Tutorial
How it works
A guide to connecting your display and using its everyday features.
Keep your primary CGM app/device for treatment decisions and primary alerts. Screen labels can differ on older app versions.
1. Power on your display
Use the power button to turn on the display. If it does not start normally, check its power connection and contact support with what appears on screen. Button locations and restart shortcuts can vary by device.
2. Connect to Wi-Fi
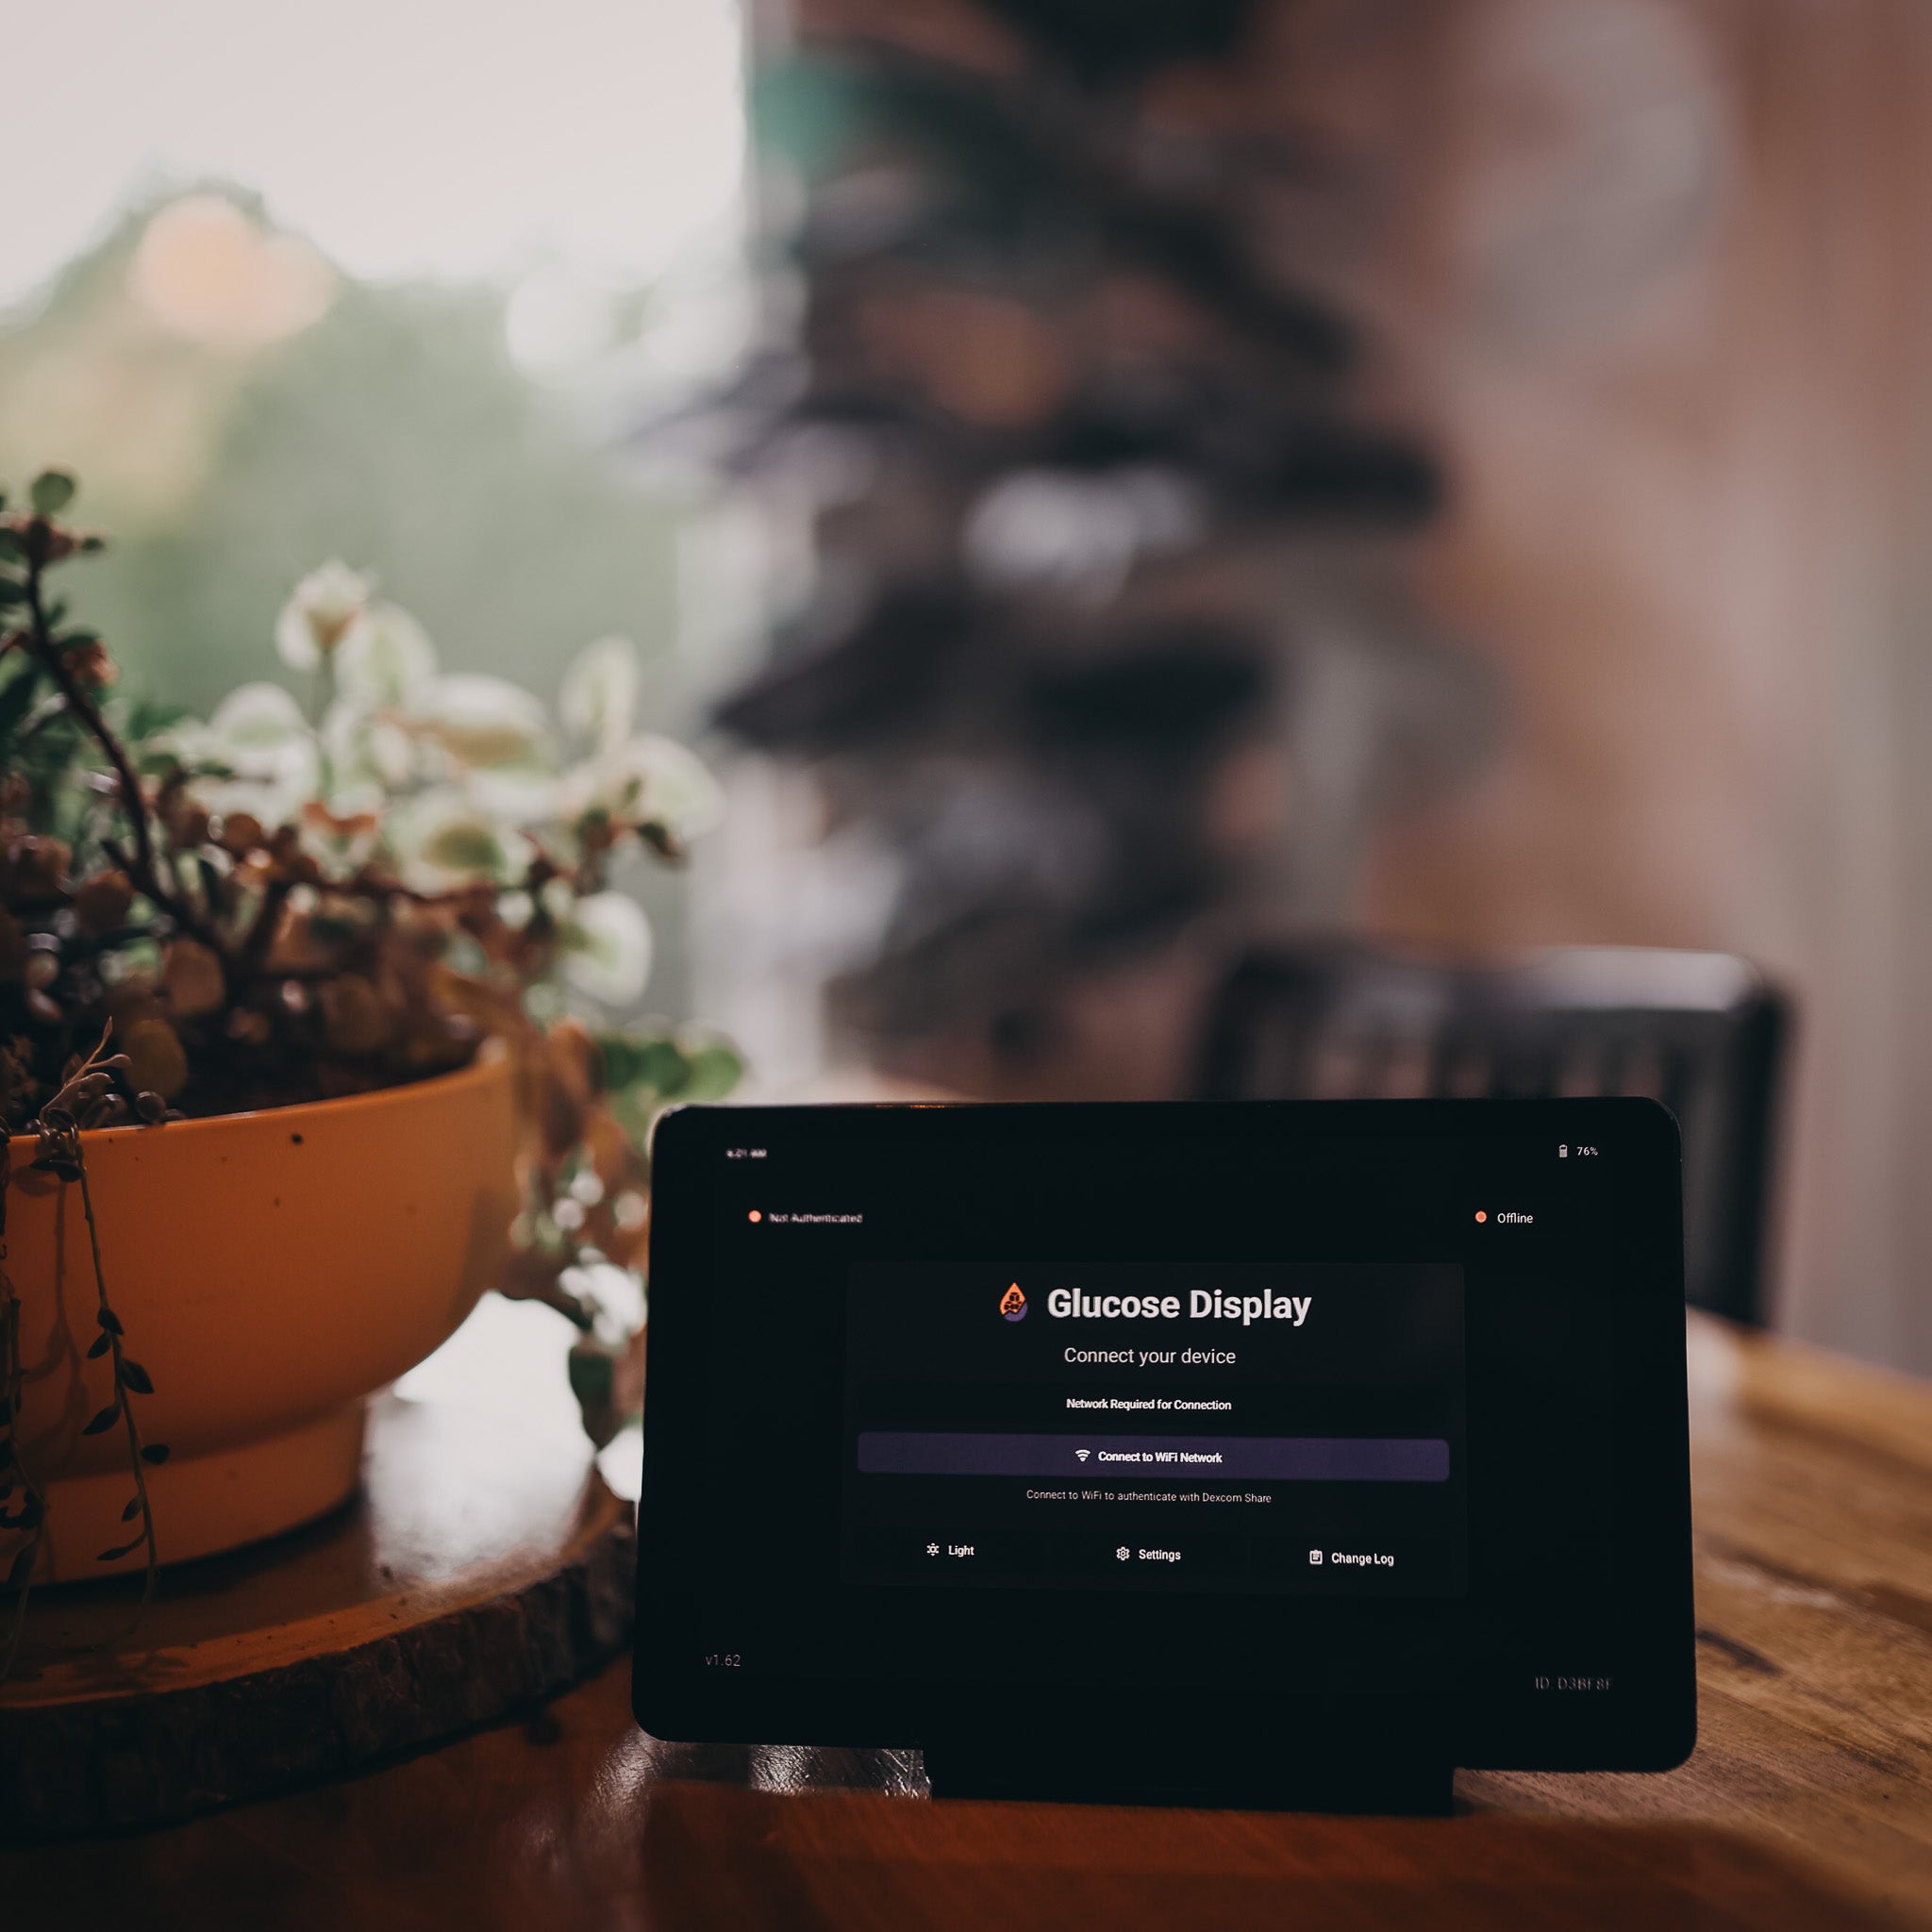
Choose Connect to WiFi Network, select your network and follow its sign-in prompts. Once connected, return to Glucose Display.
3. Check the connection
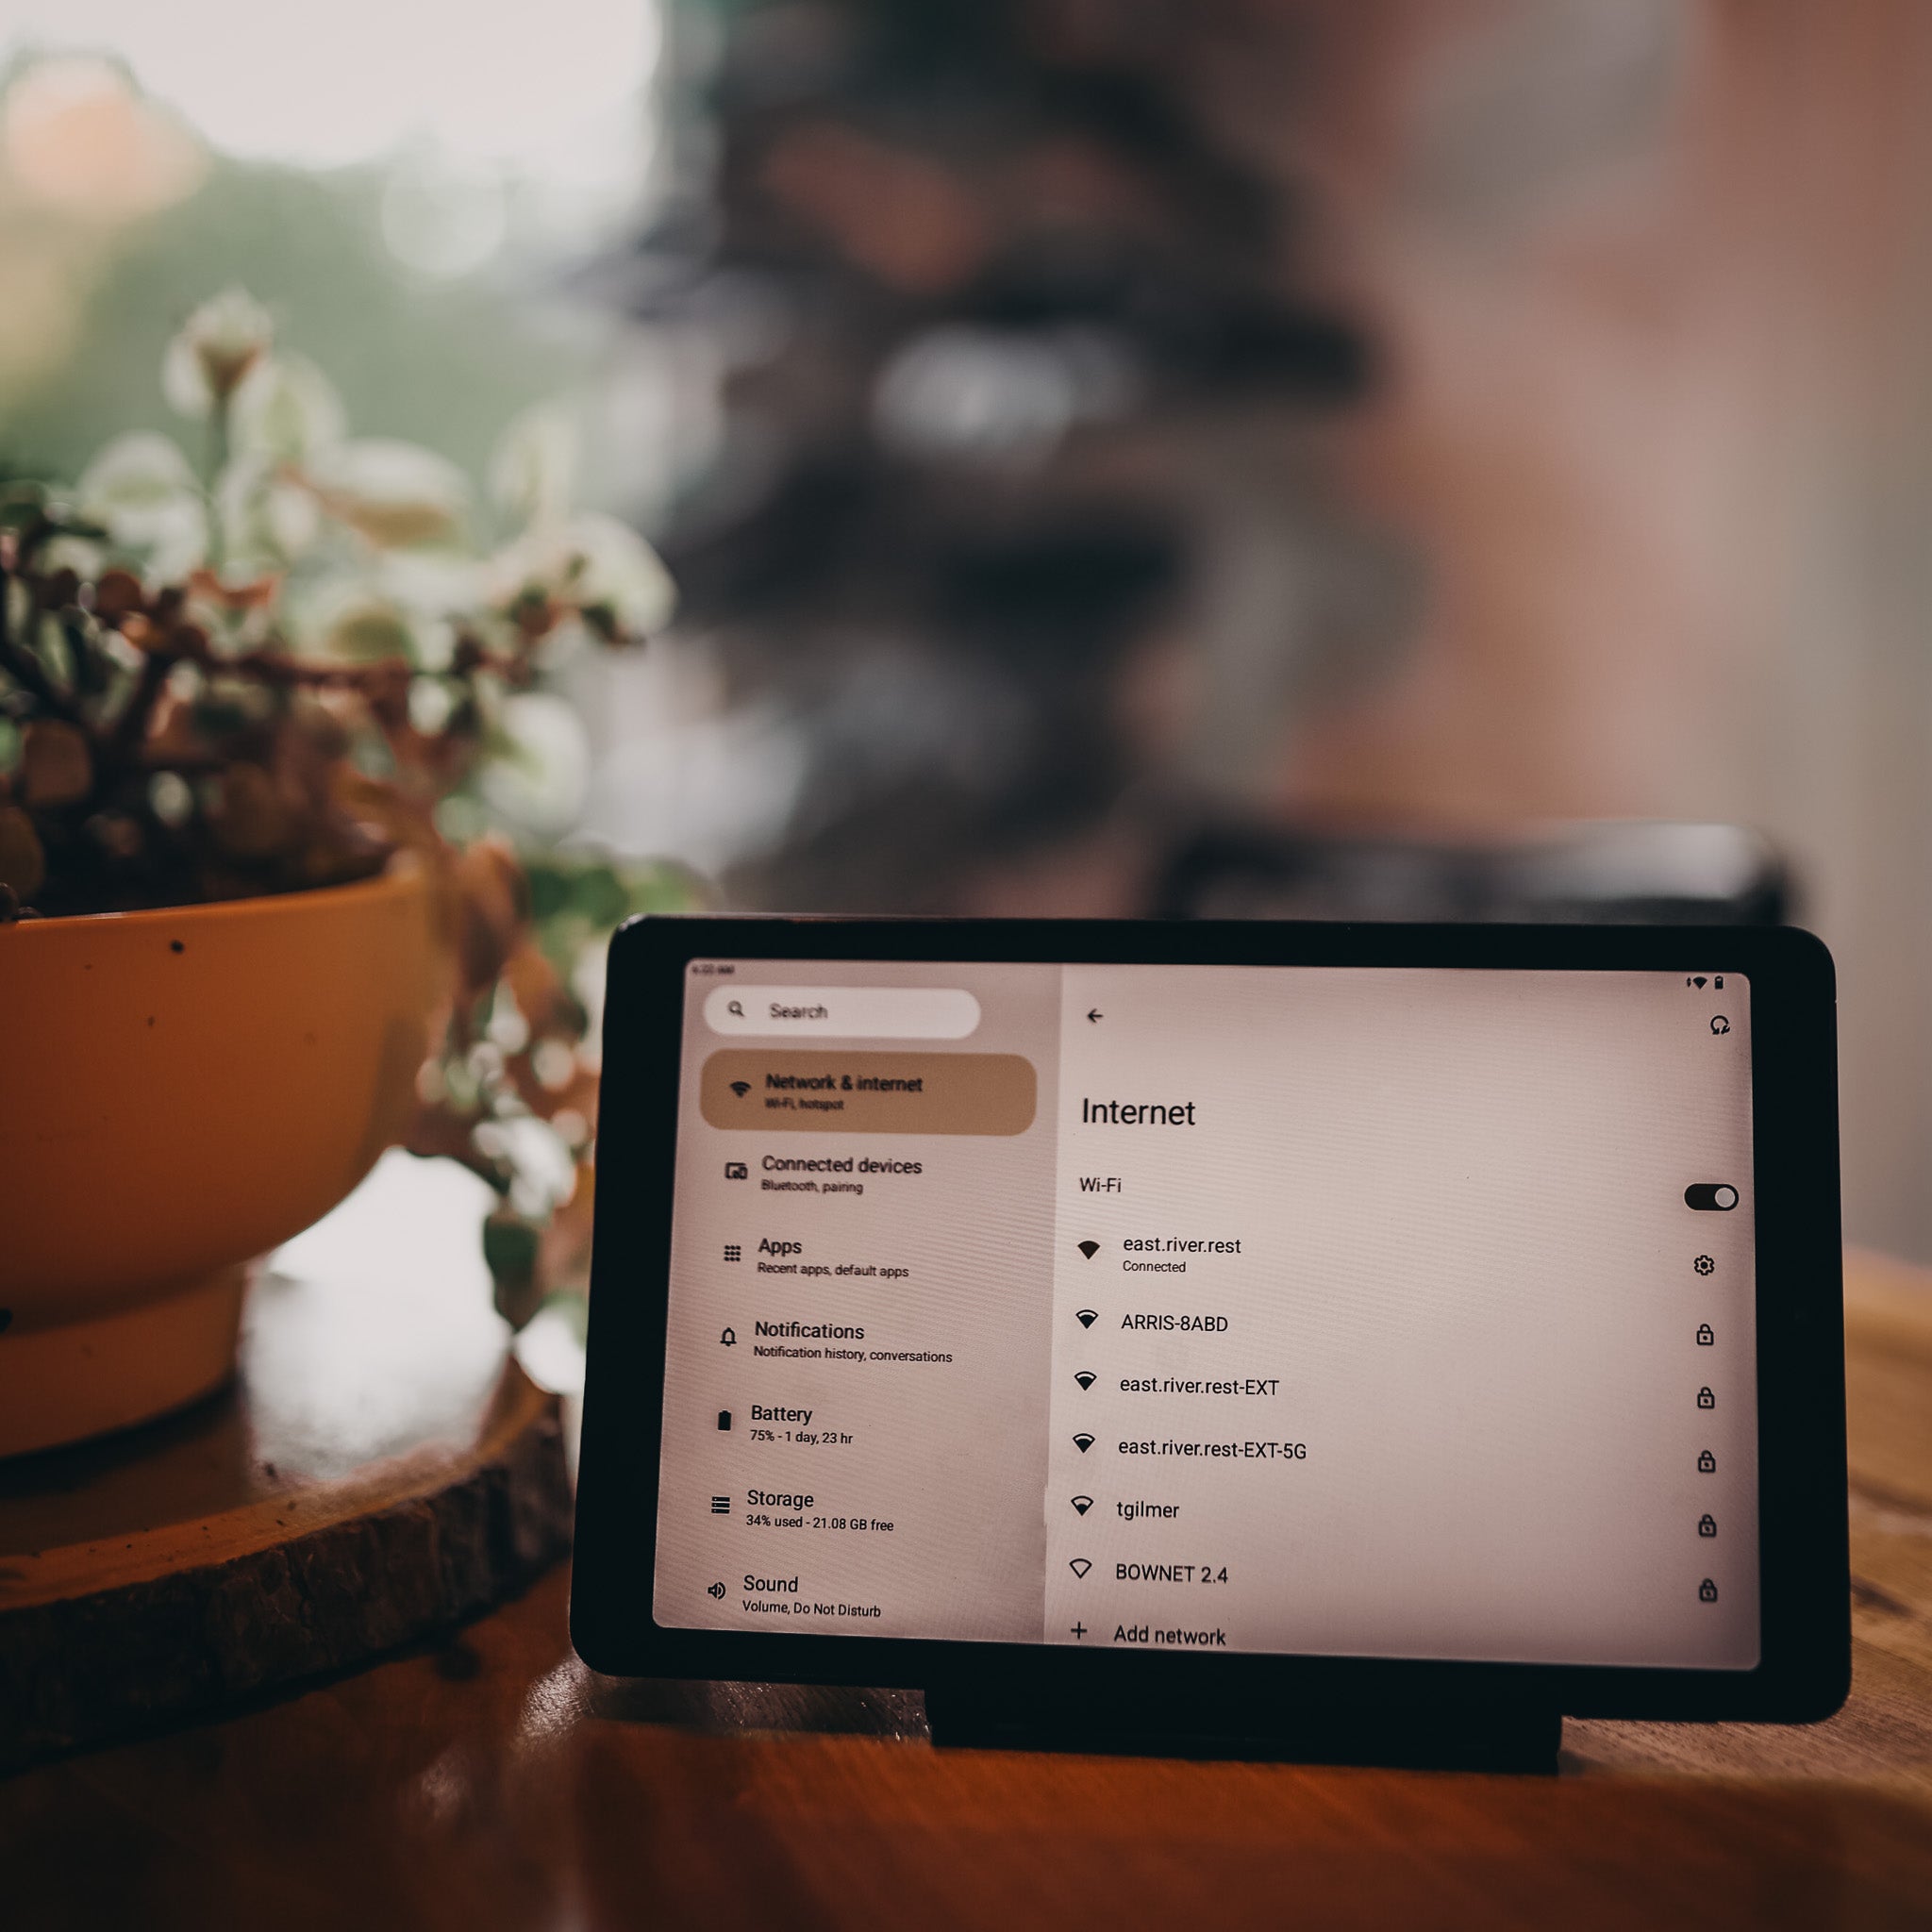
Use the network status control to check connectivity or change networks. The display needs Wi-Fi with internet access to receive new readings.
4. Choose your source
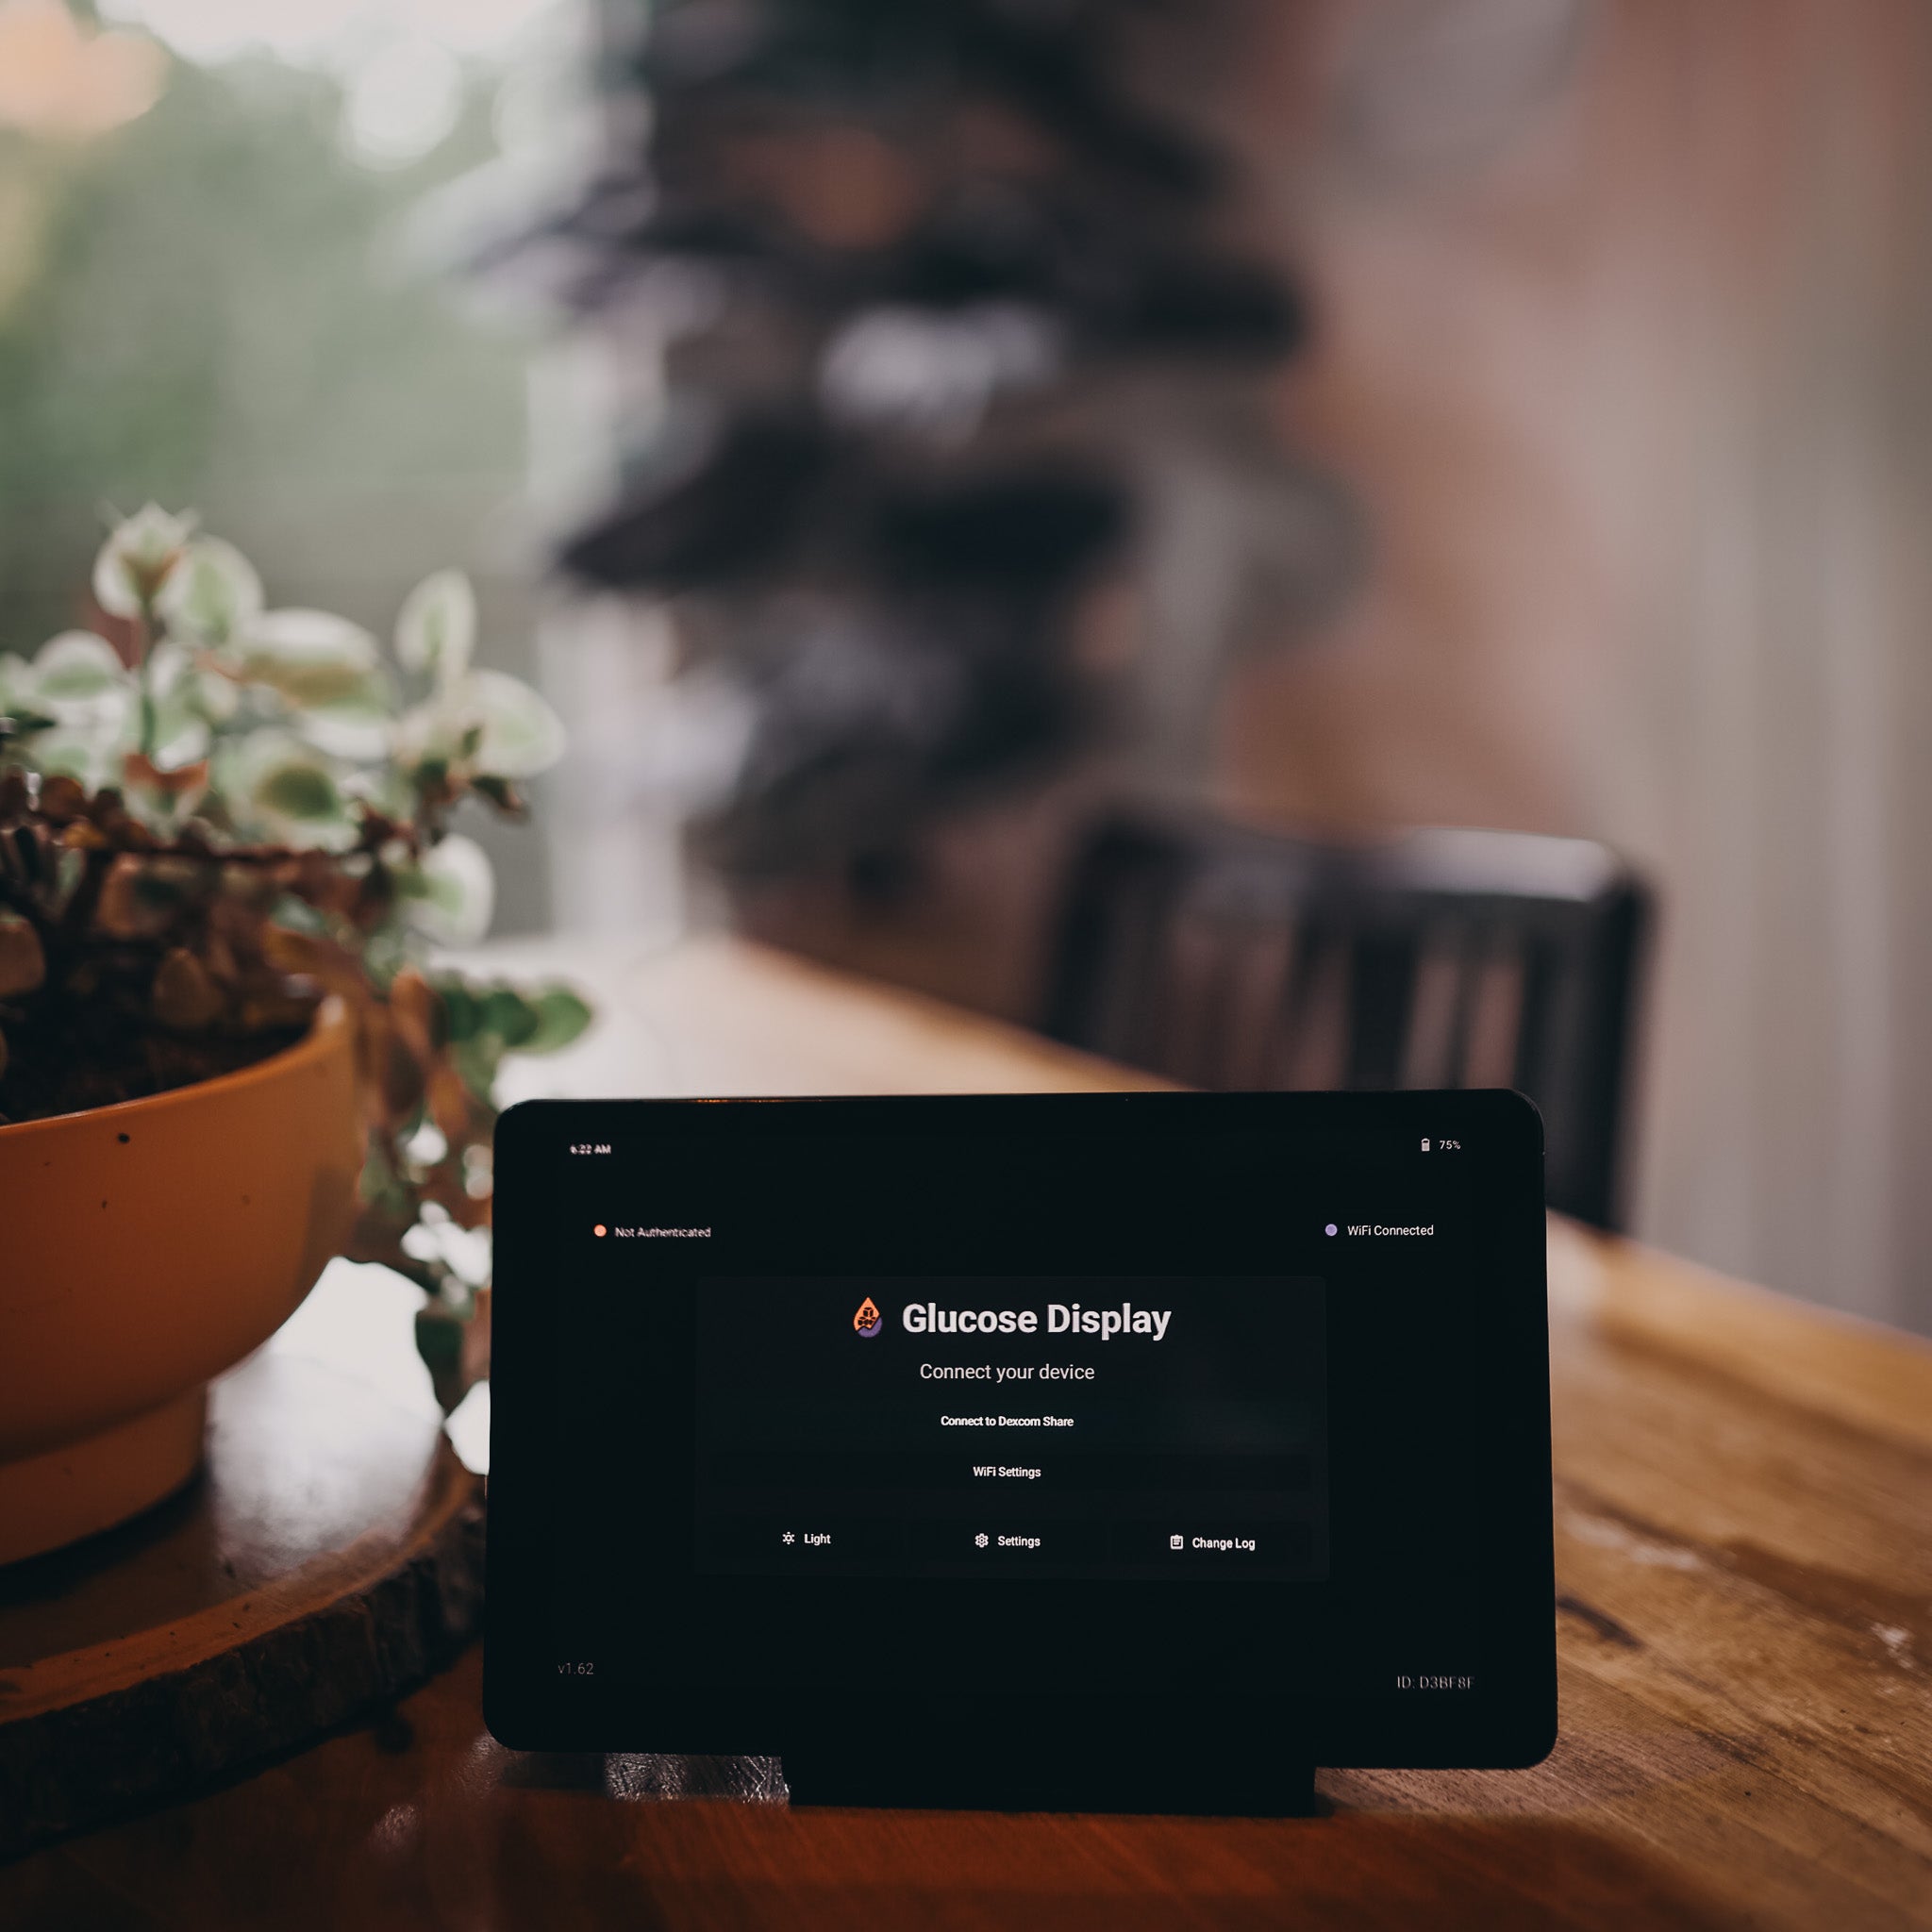
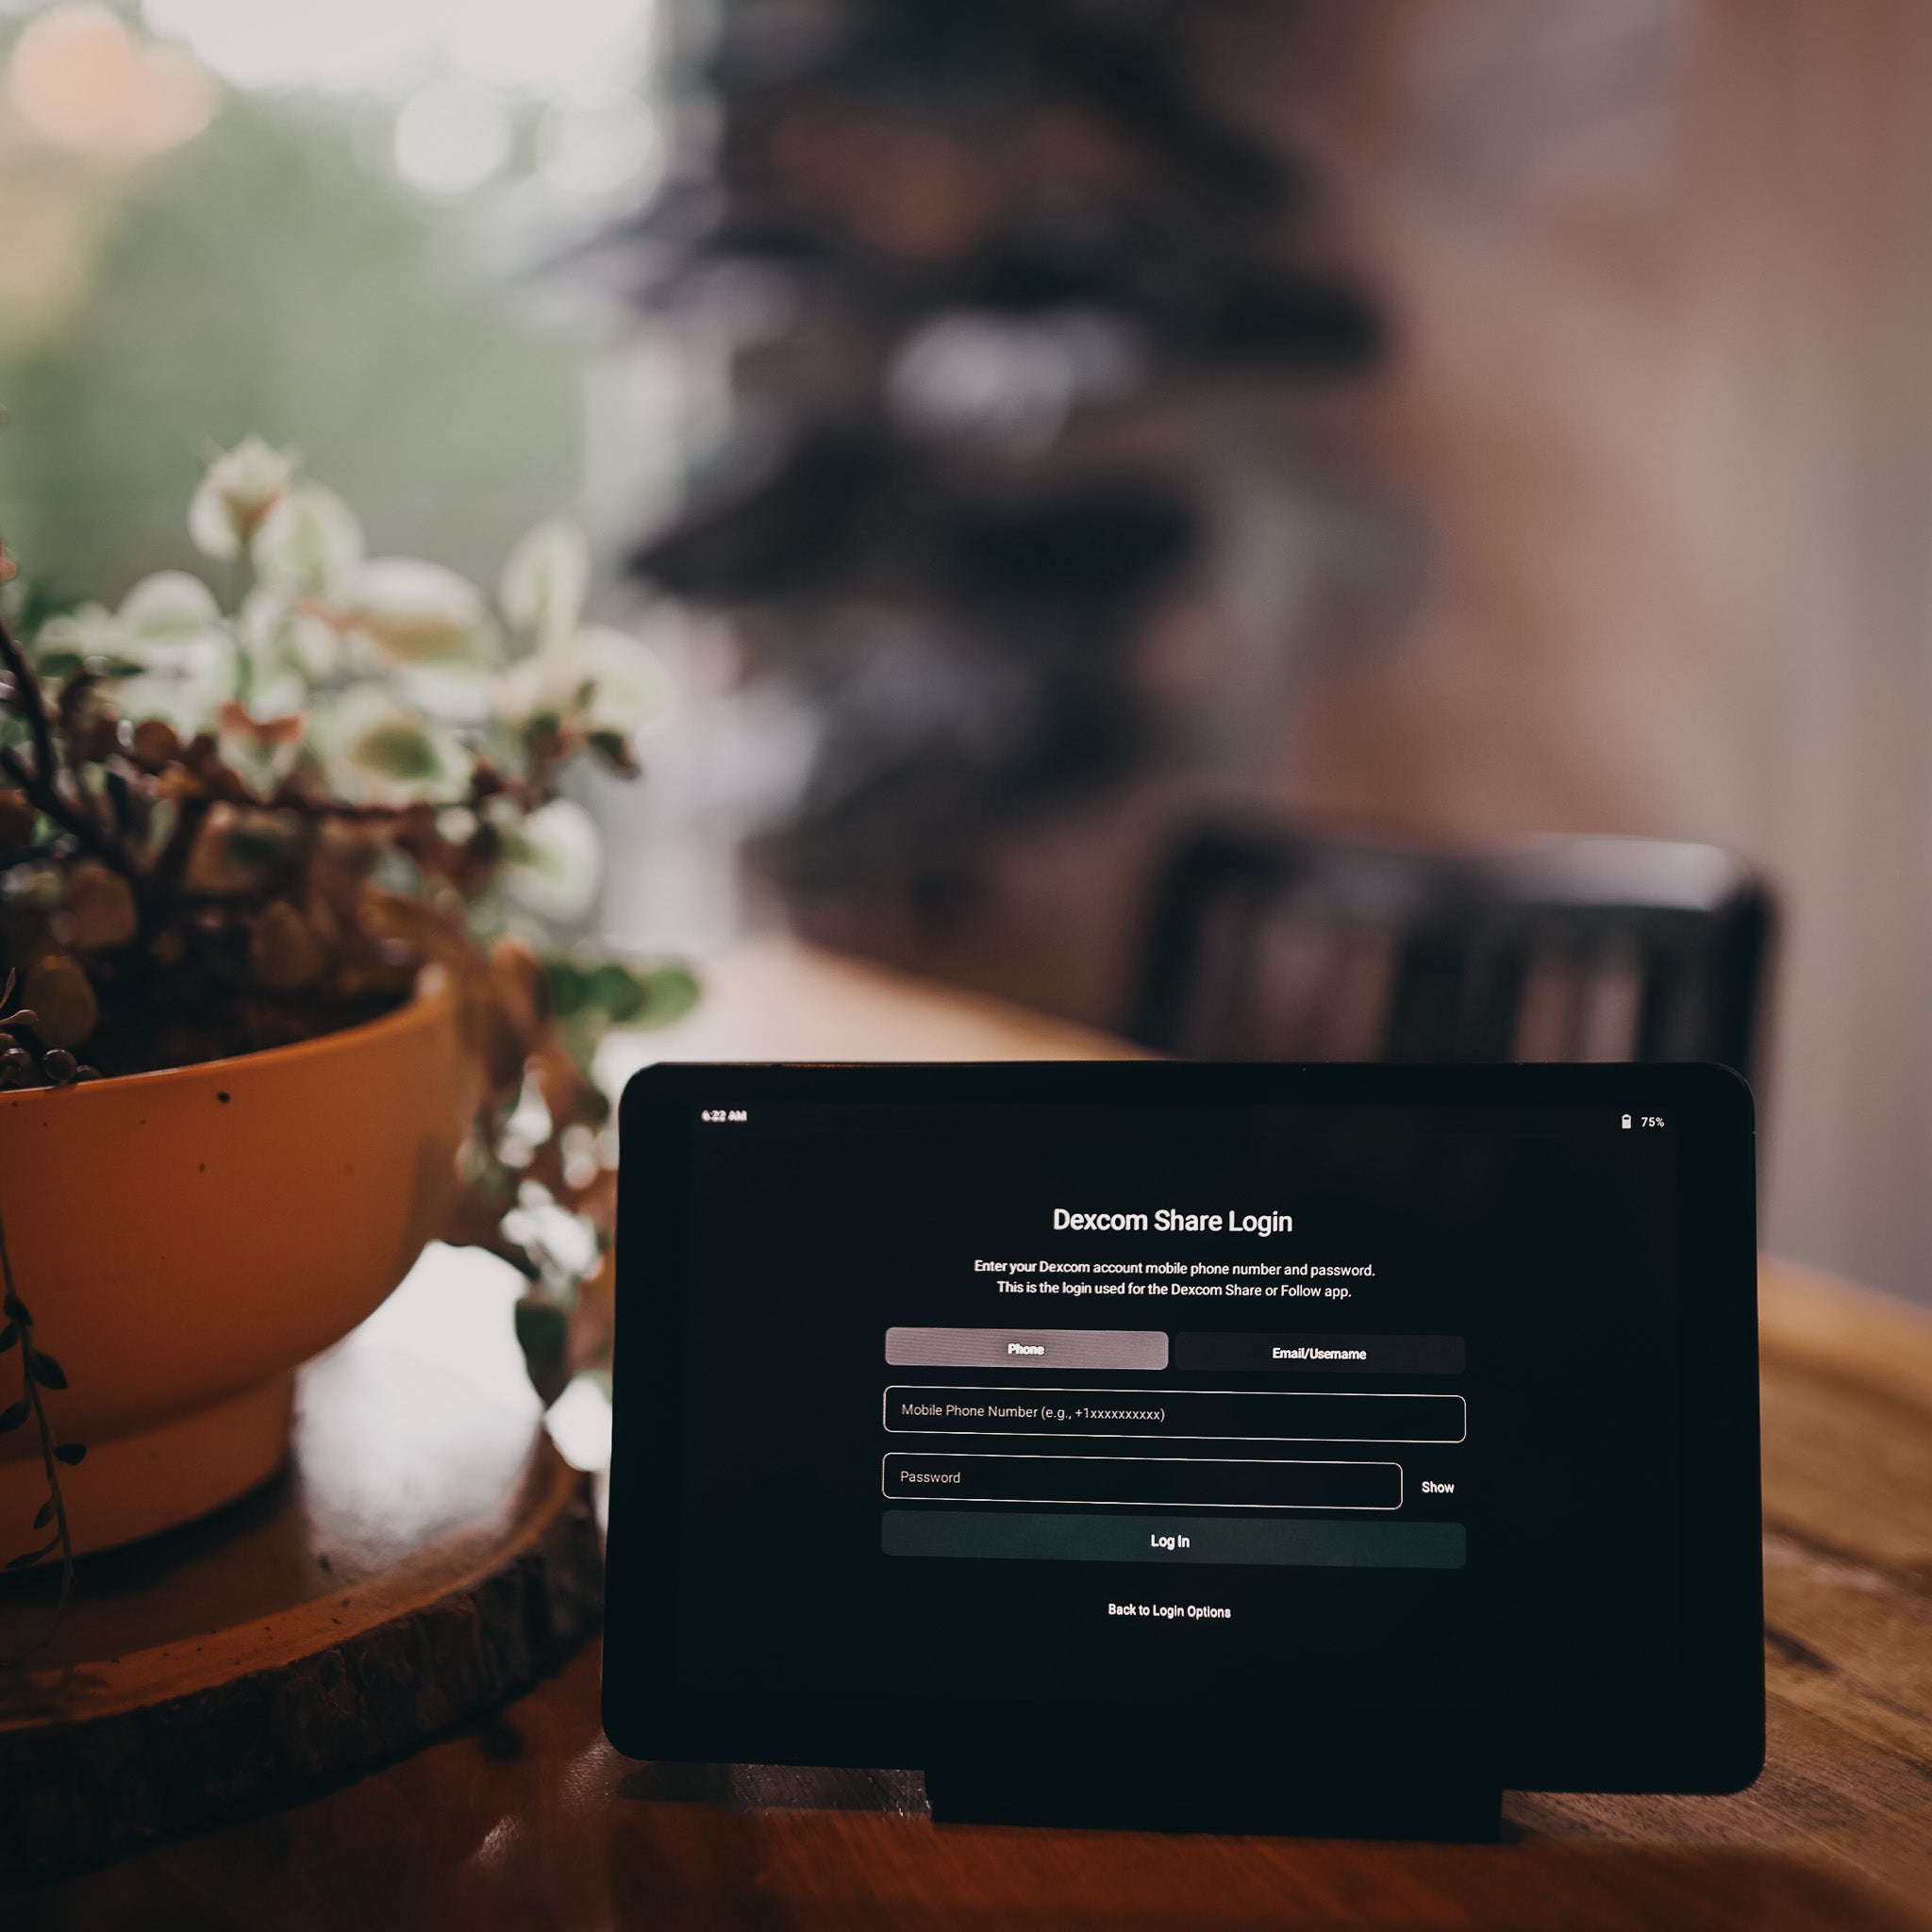
Choose Dexcom Share, LibreLinkUp or Nightscout. The account you need depends on the provider. Follow the connection guide for your source.
5. Your dashboard
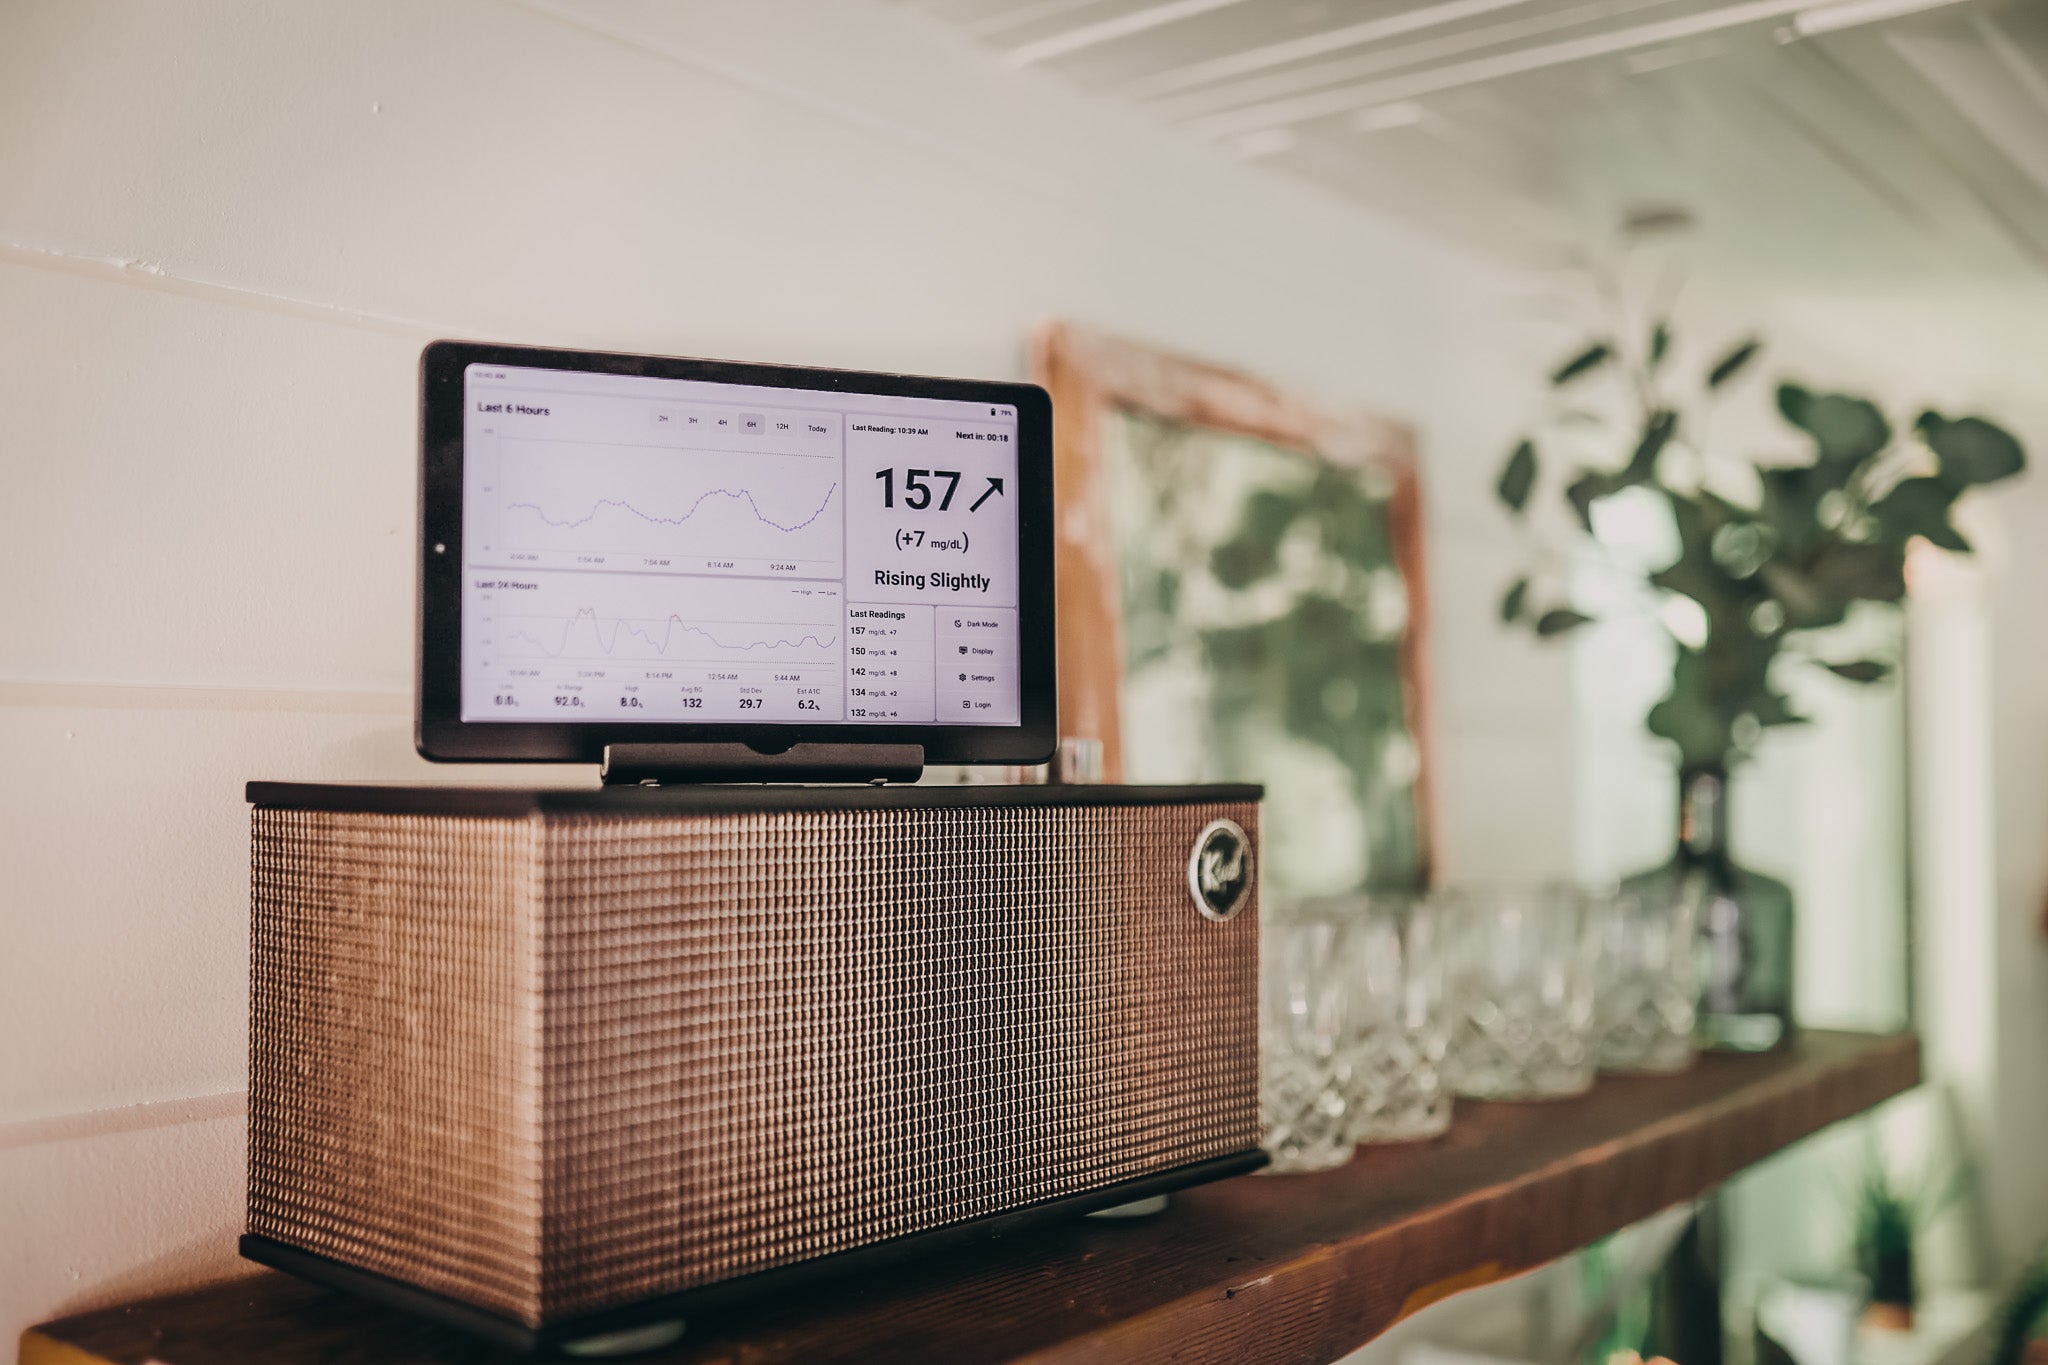
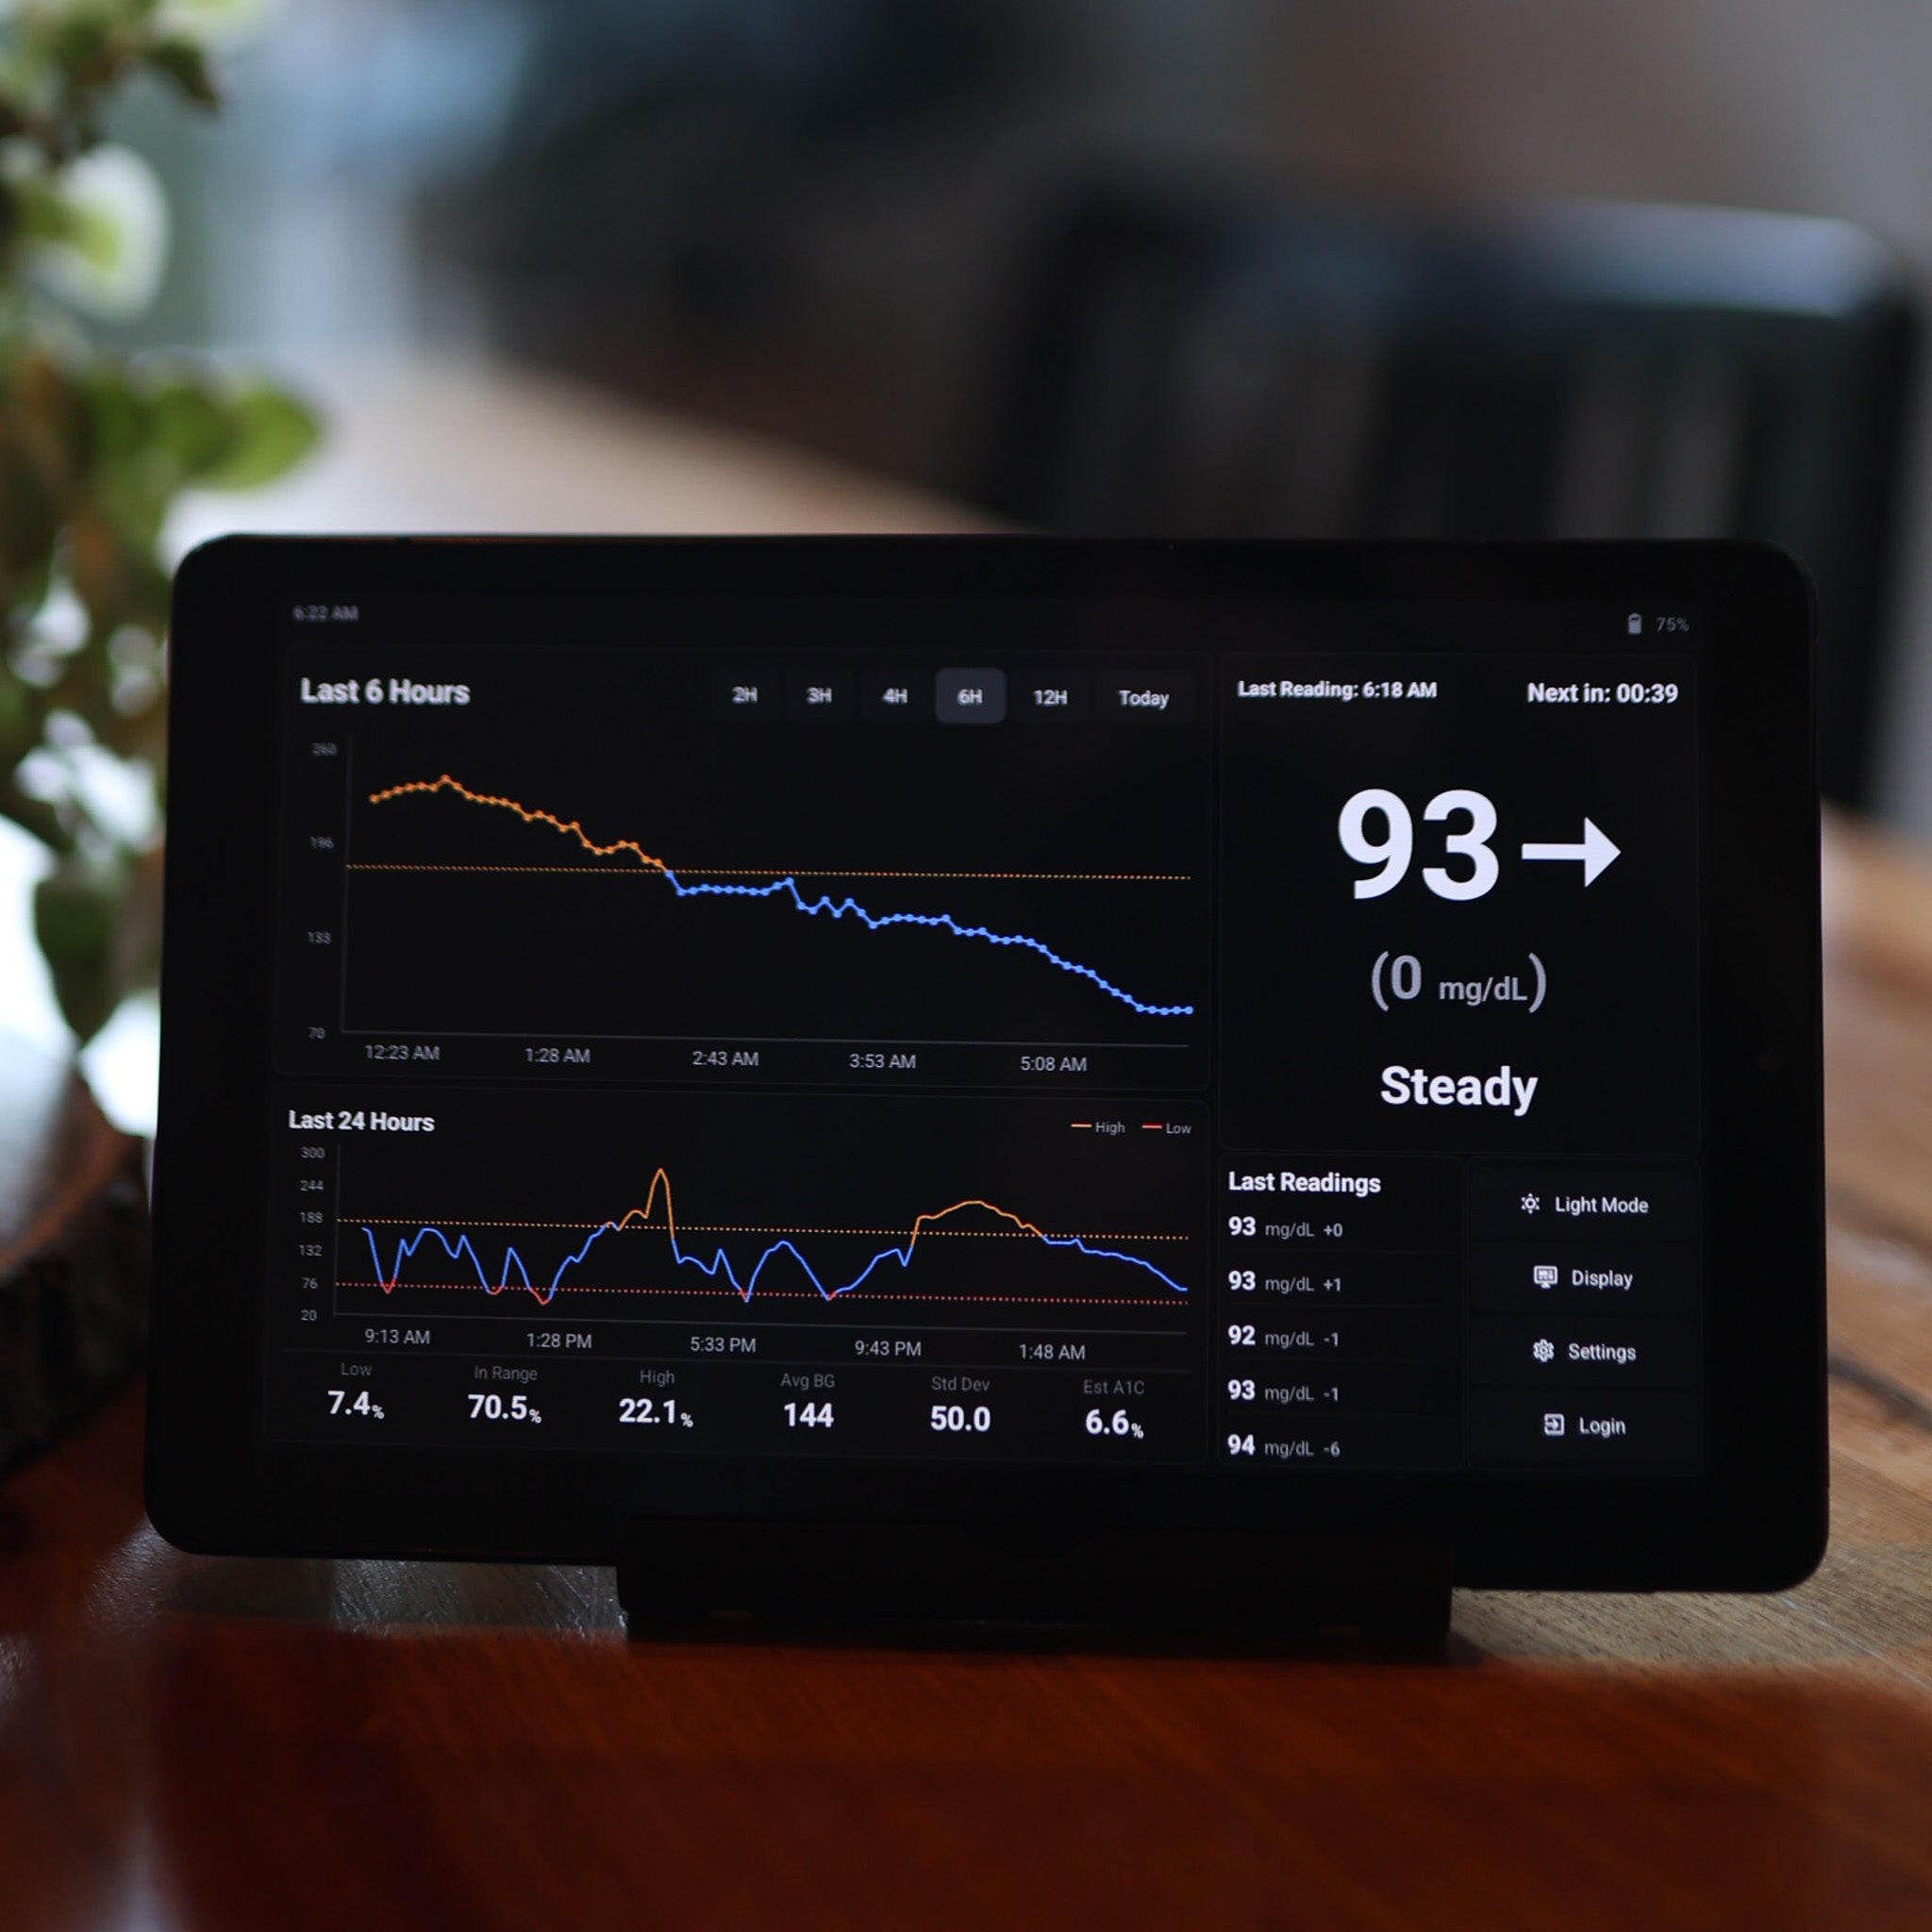
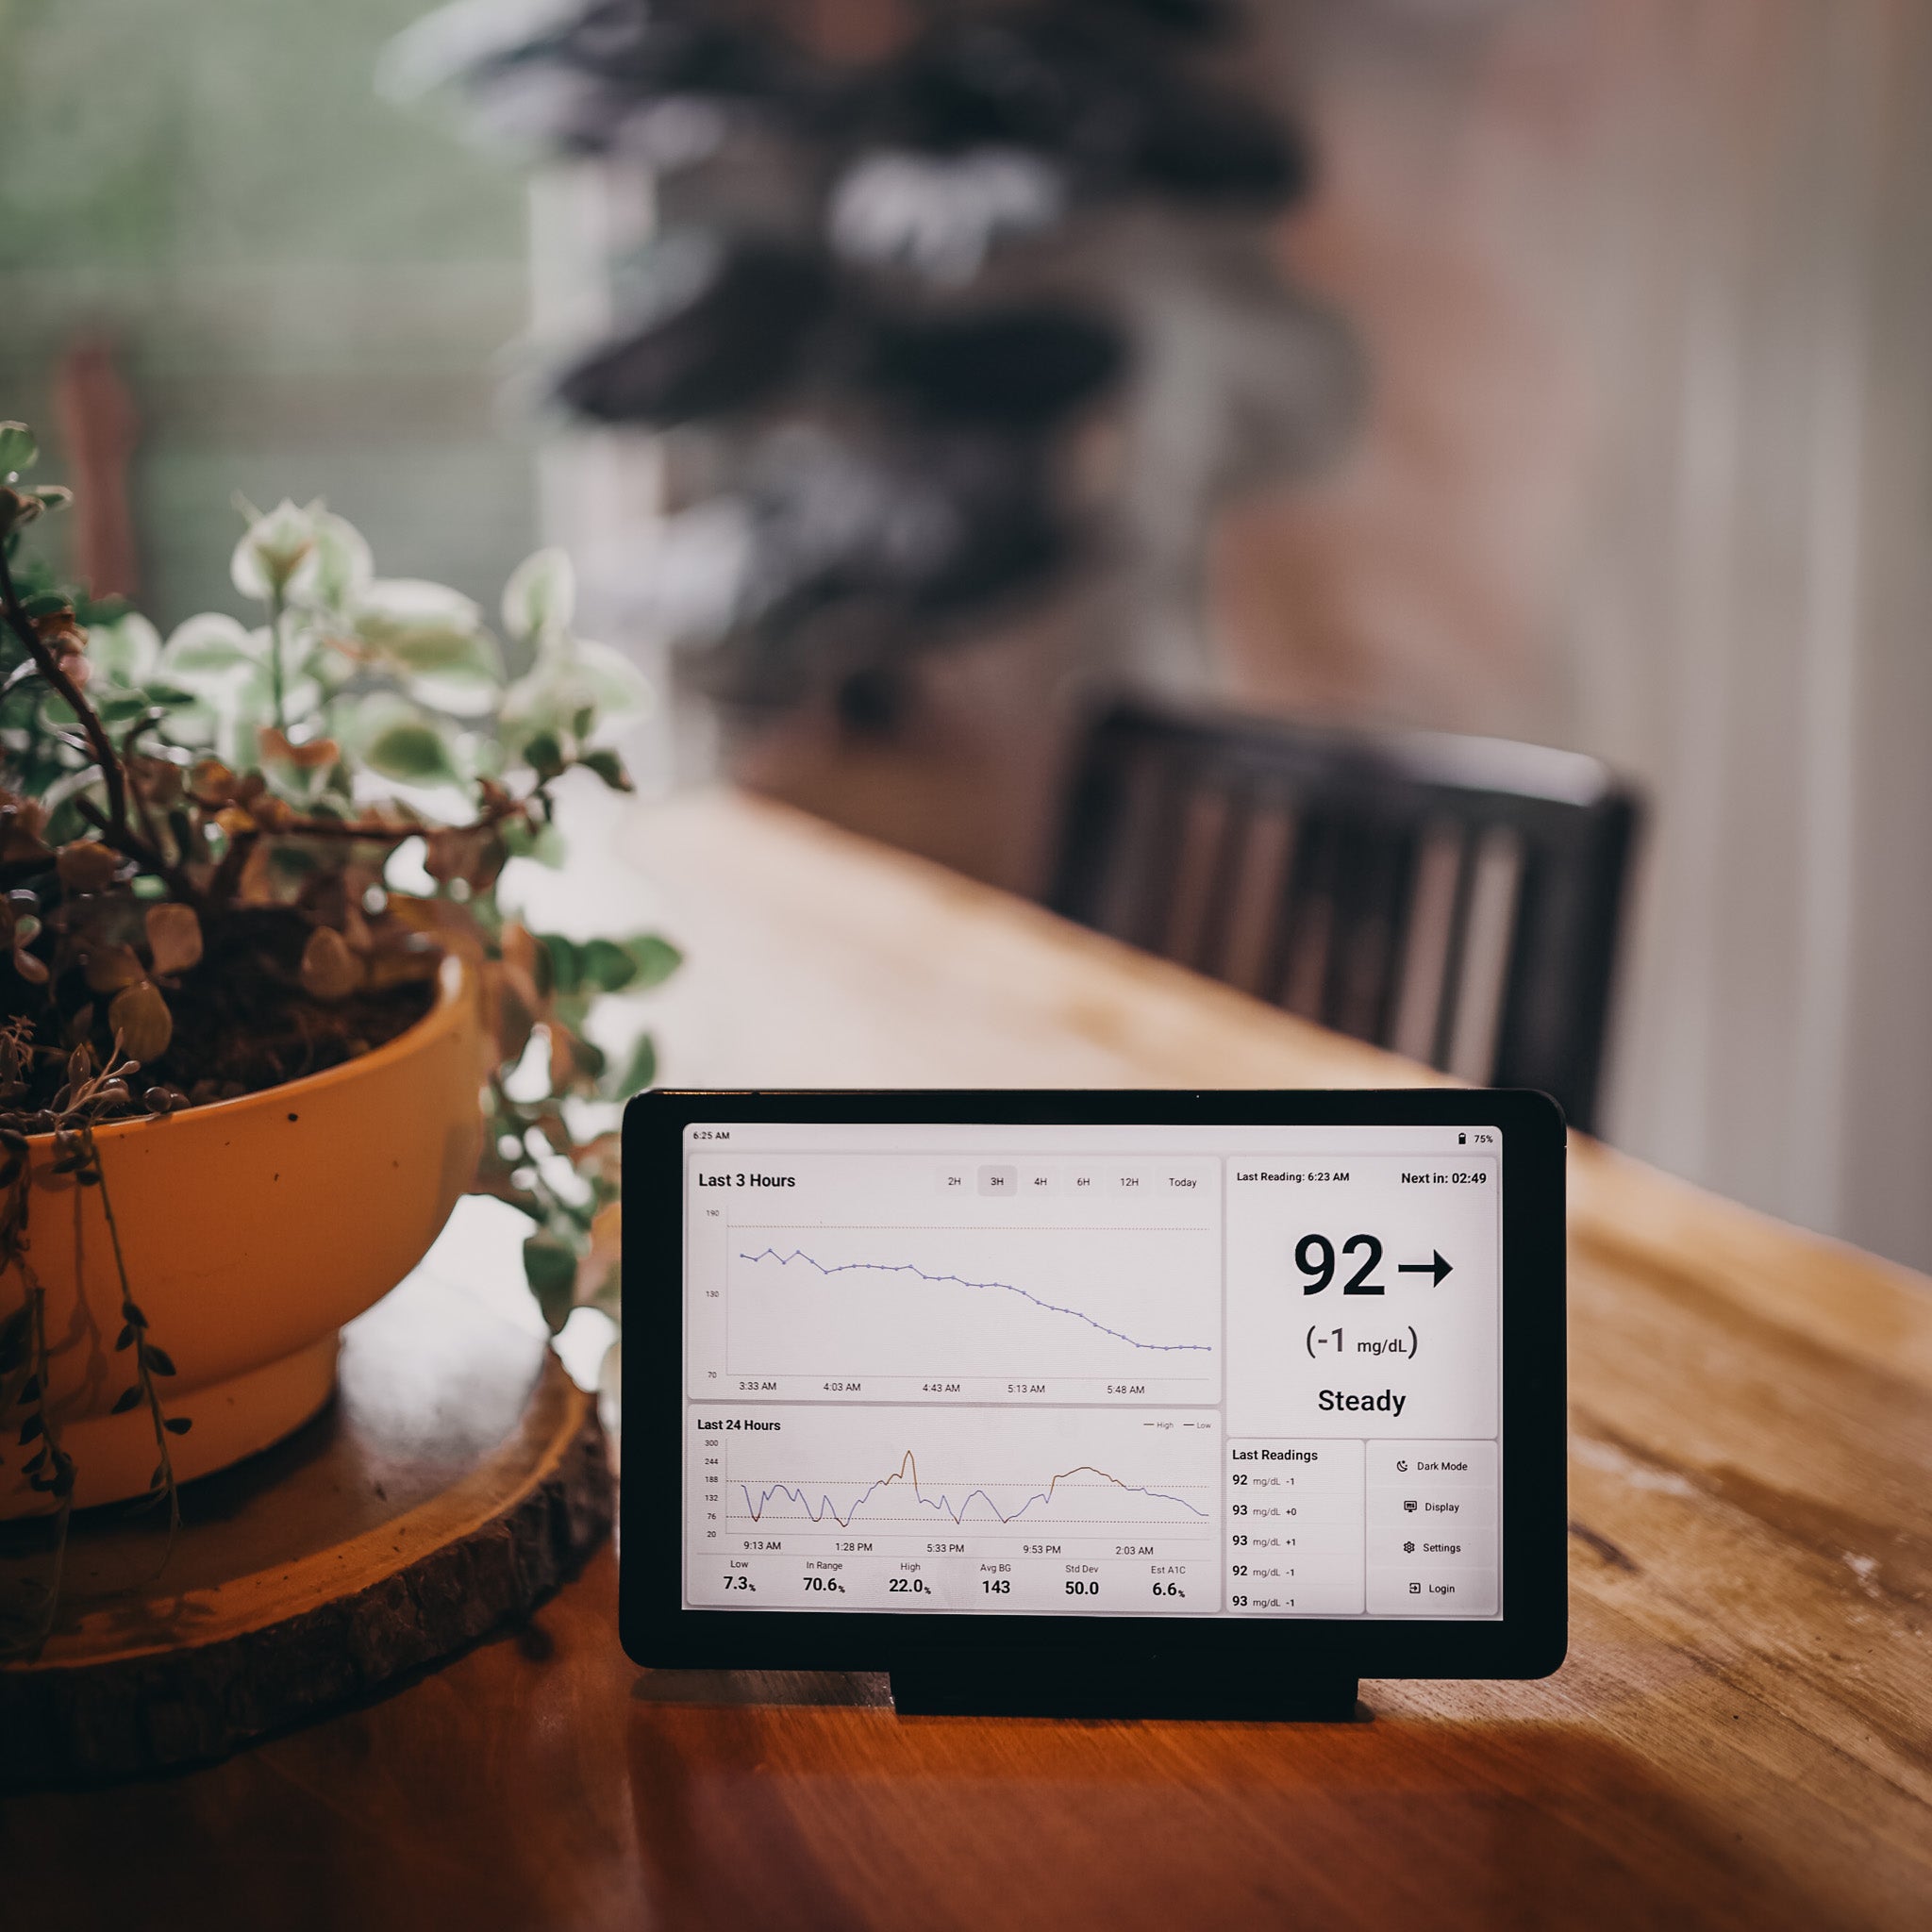
The dashboard brings the current reading, trend and graphs together. Check the reading timestamp when assessing how current the displayed data is. Double-tap the glucose number to open the larger view.
The summary below the graphs
The dashboard uses the available readings from the last 24 hours, independently of the upper chart’s selected time range.
- Low / In Range / High
- The percentage of available readings below, within or above your configured thresholds. Readings equal to either threshold count as in range.
- Avg BG
- The average glucose value across those readings.
- Std Dev
- Standard deviation: how spread out the readings are around that average.
- Est A1C
- A calculation from that average glucose. This short-window estimate is not a laboratory A1C result.
Missing readings can affect the summary; it does not guarantee a complete day of data. Use your primary CGM and care team’s guidance for treatment decisions.
6. Large-number view
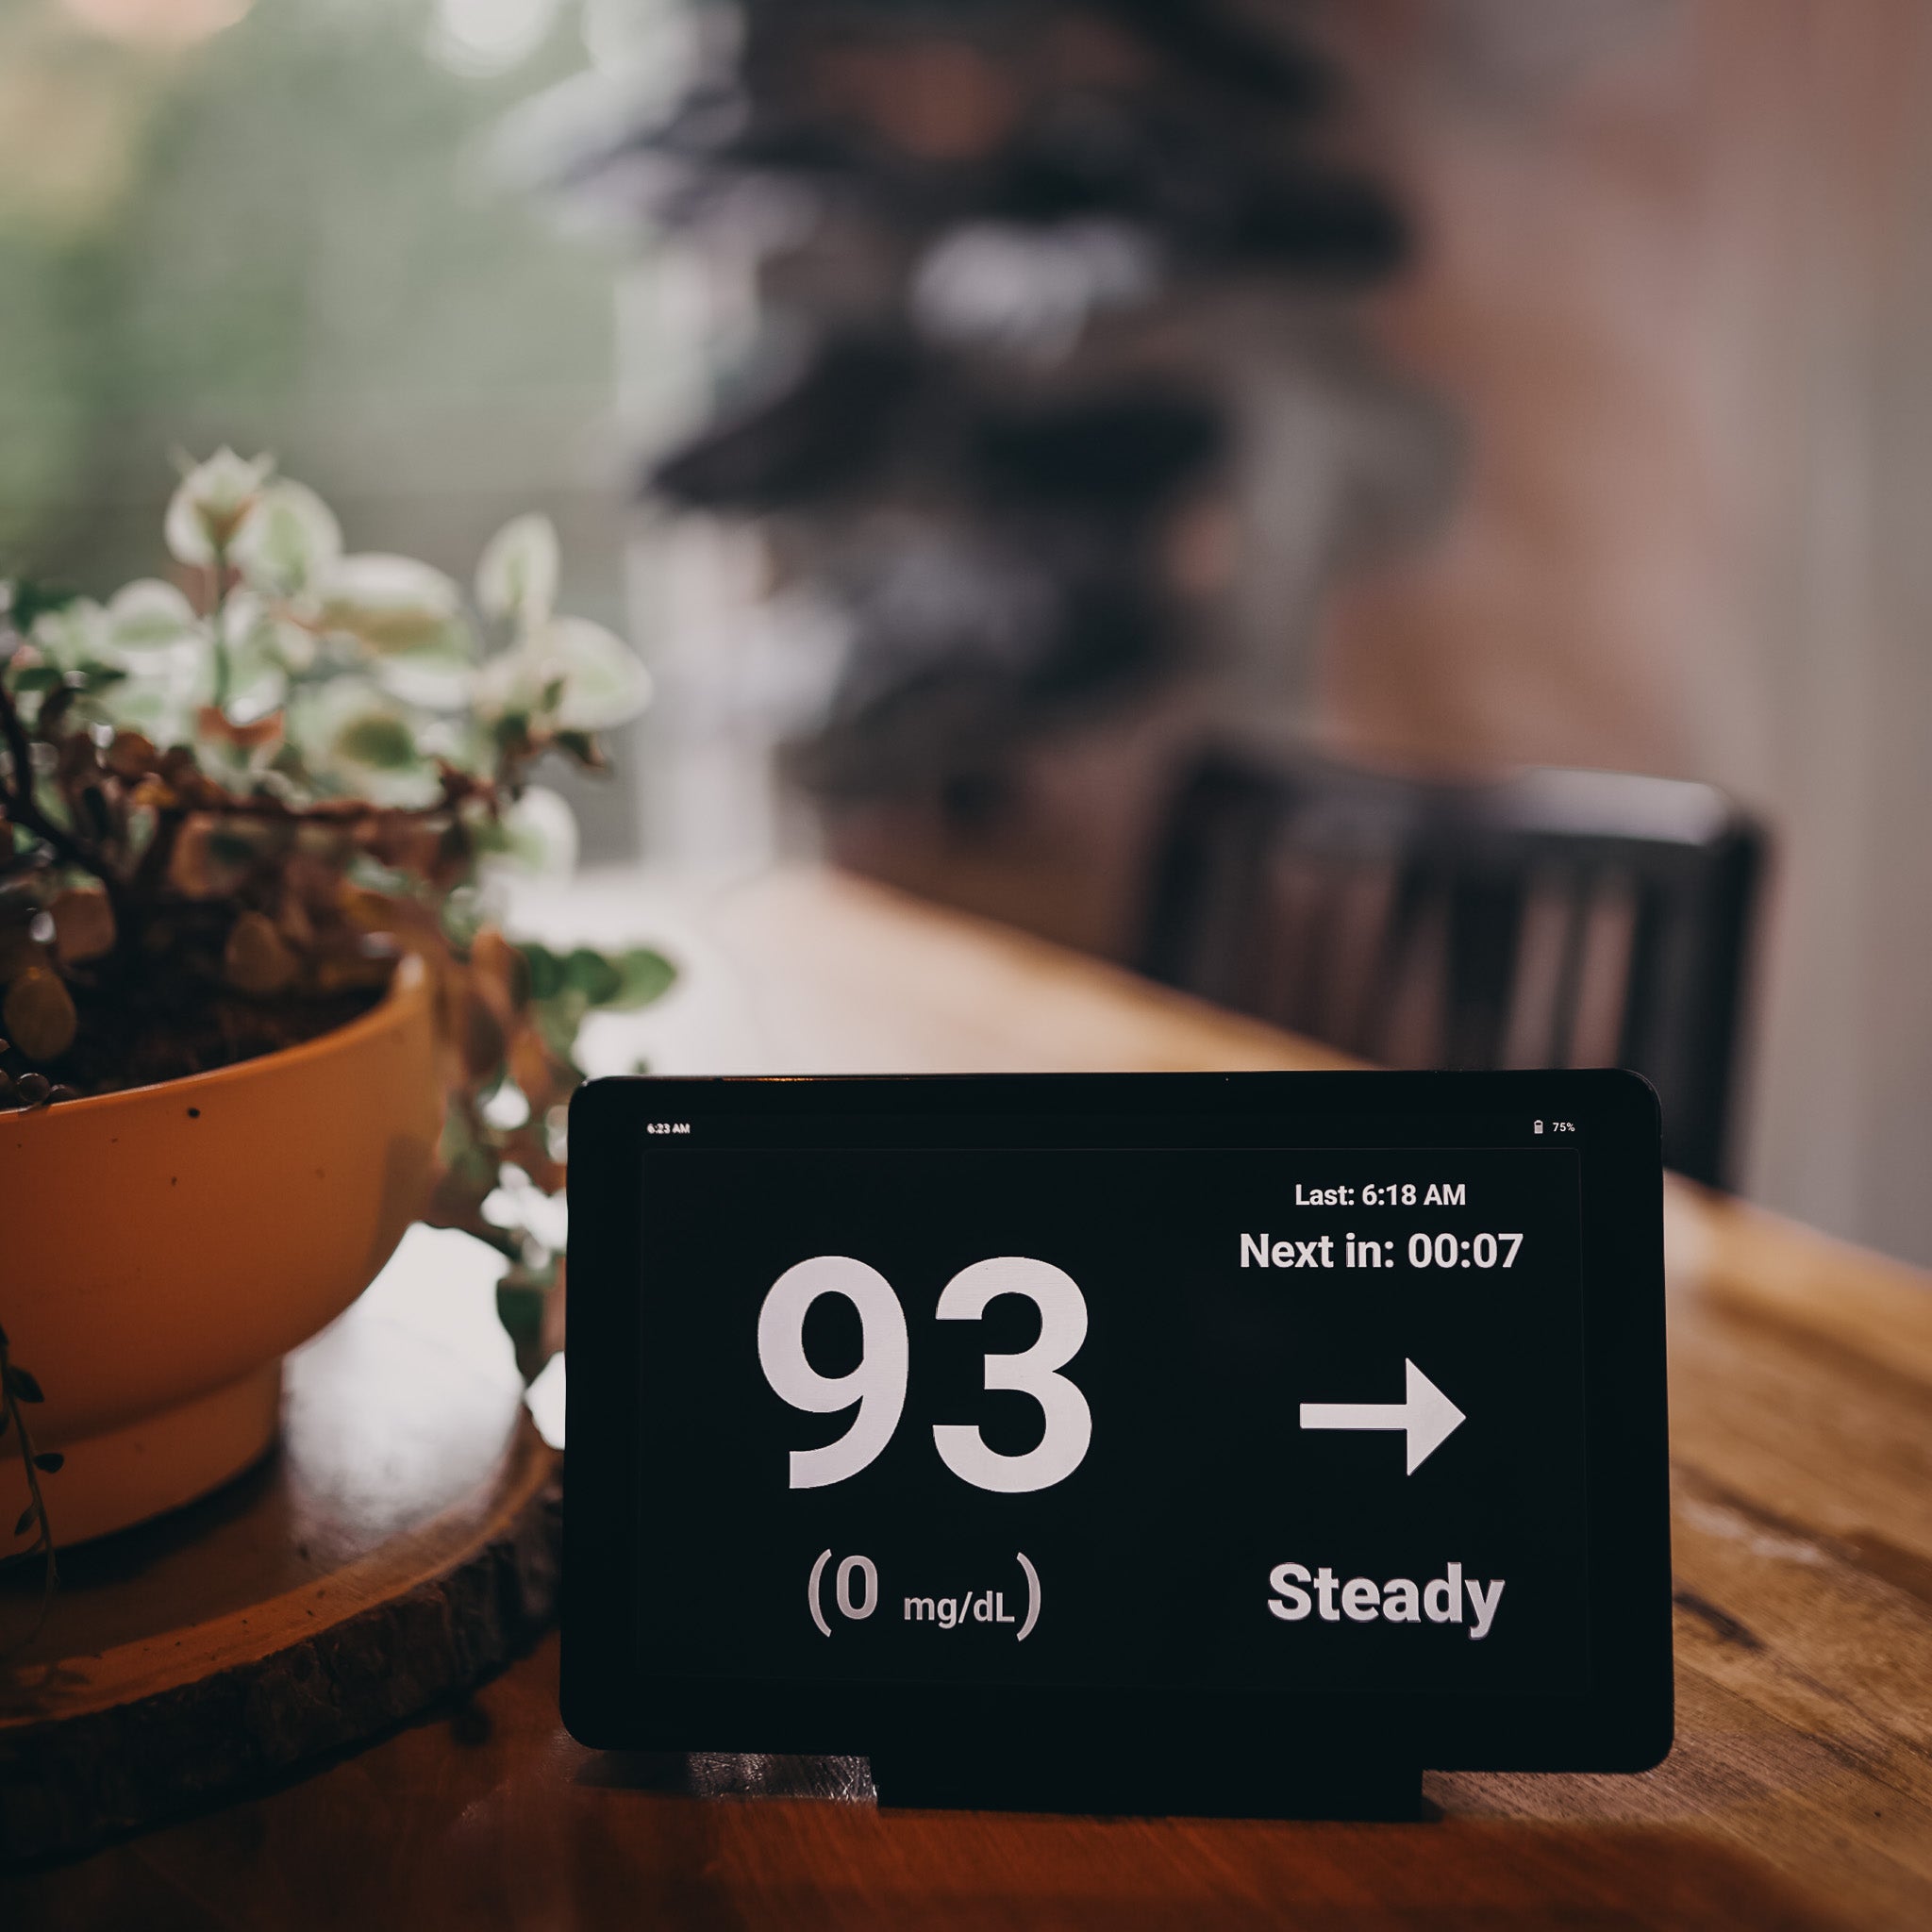
See the current glucose reading, change from the previous reading, trend information and reading time in a larger layout. A polling countdown is an estimate of the next check, not a guarantee of a new reading. Double-tap to return.
7. Recent reading history
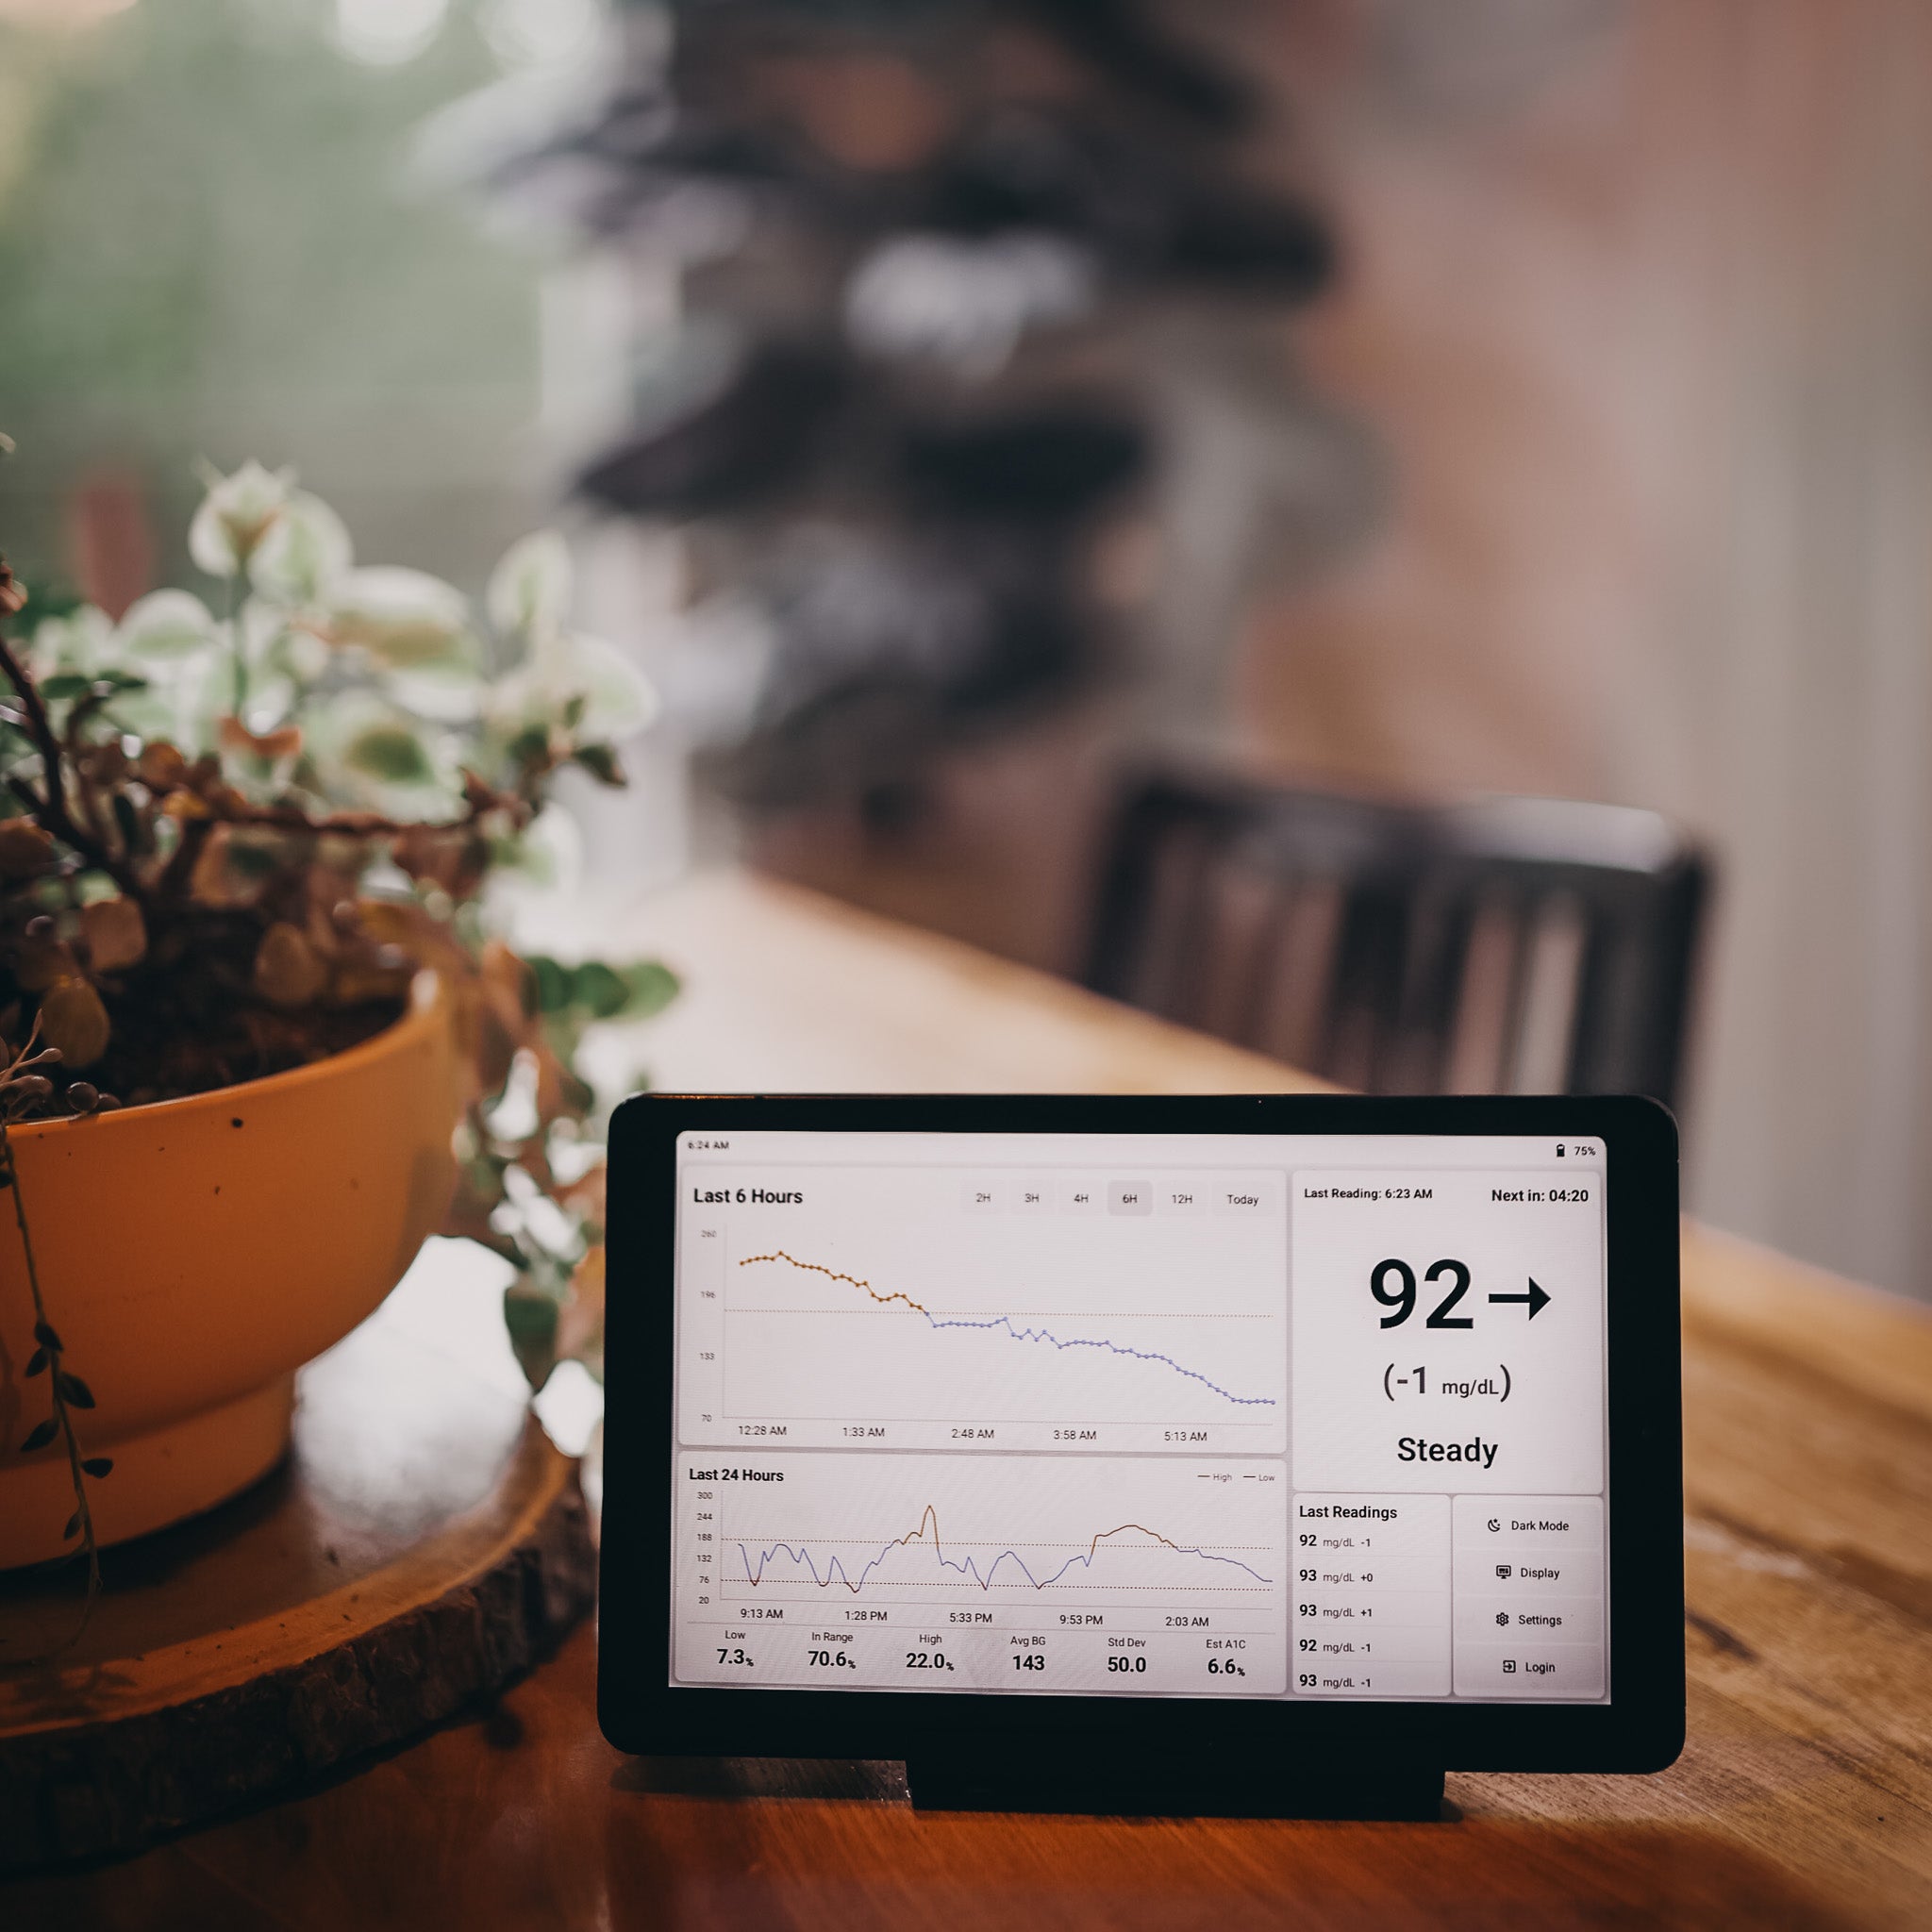
Use the upper chart’s time-range control to change the period shown. Double-tap the upper chart to open the longer history view.
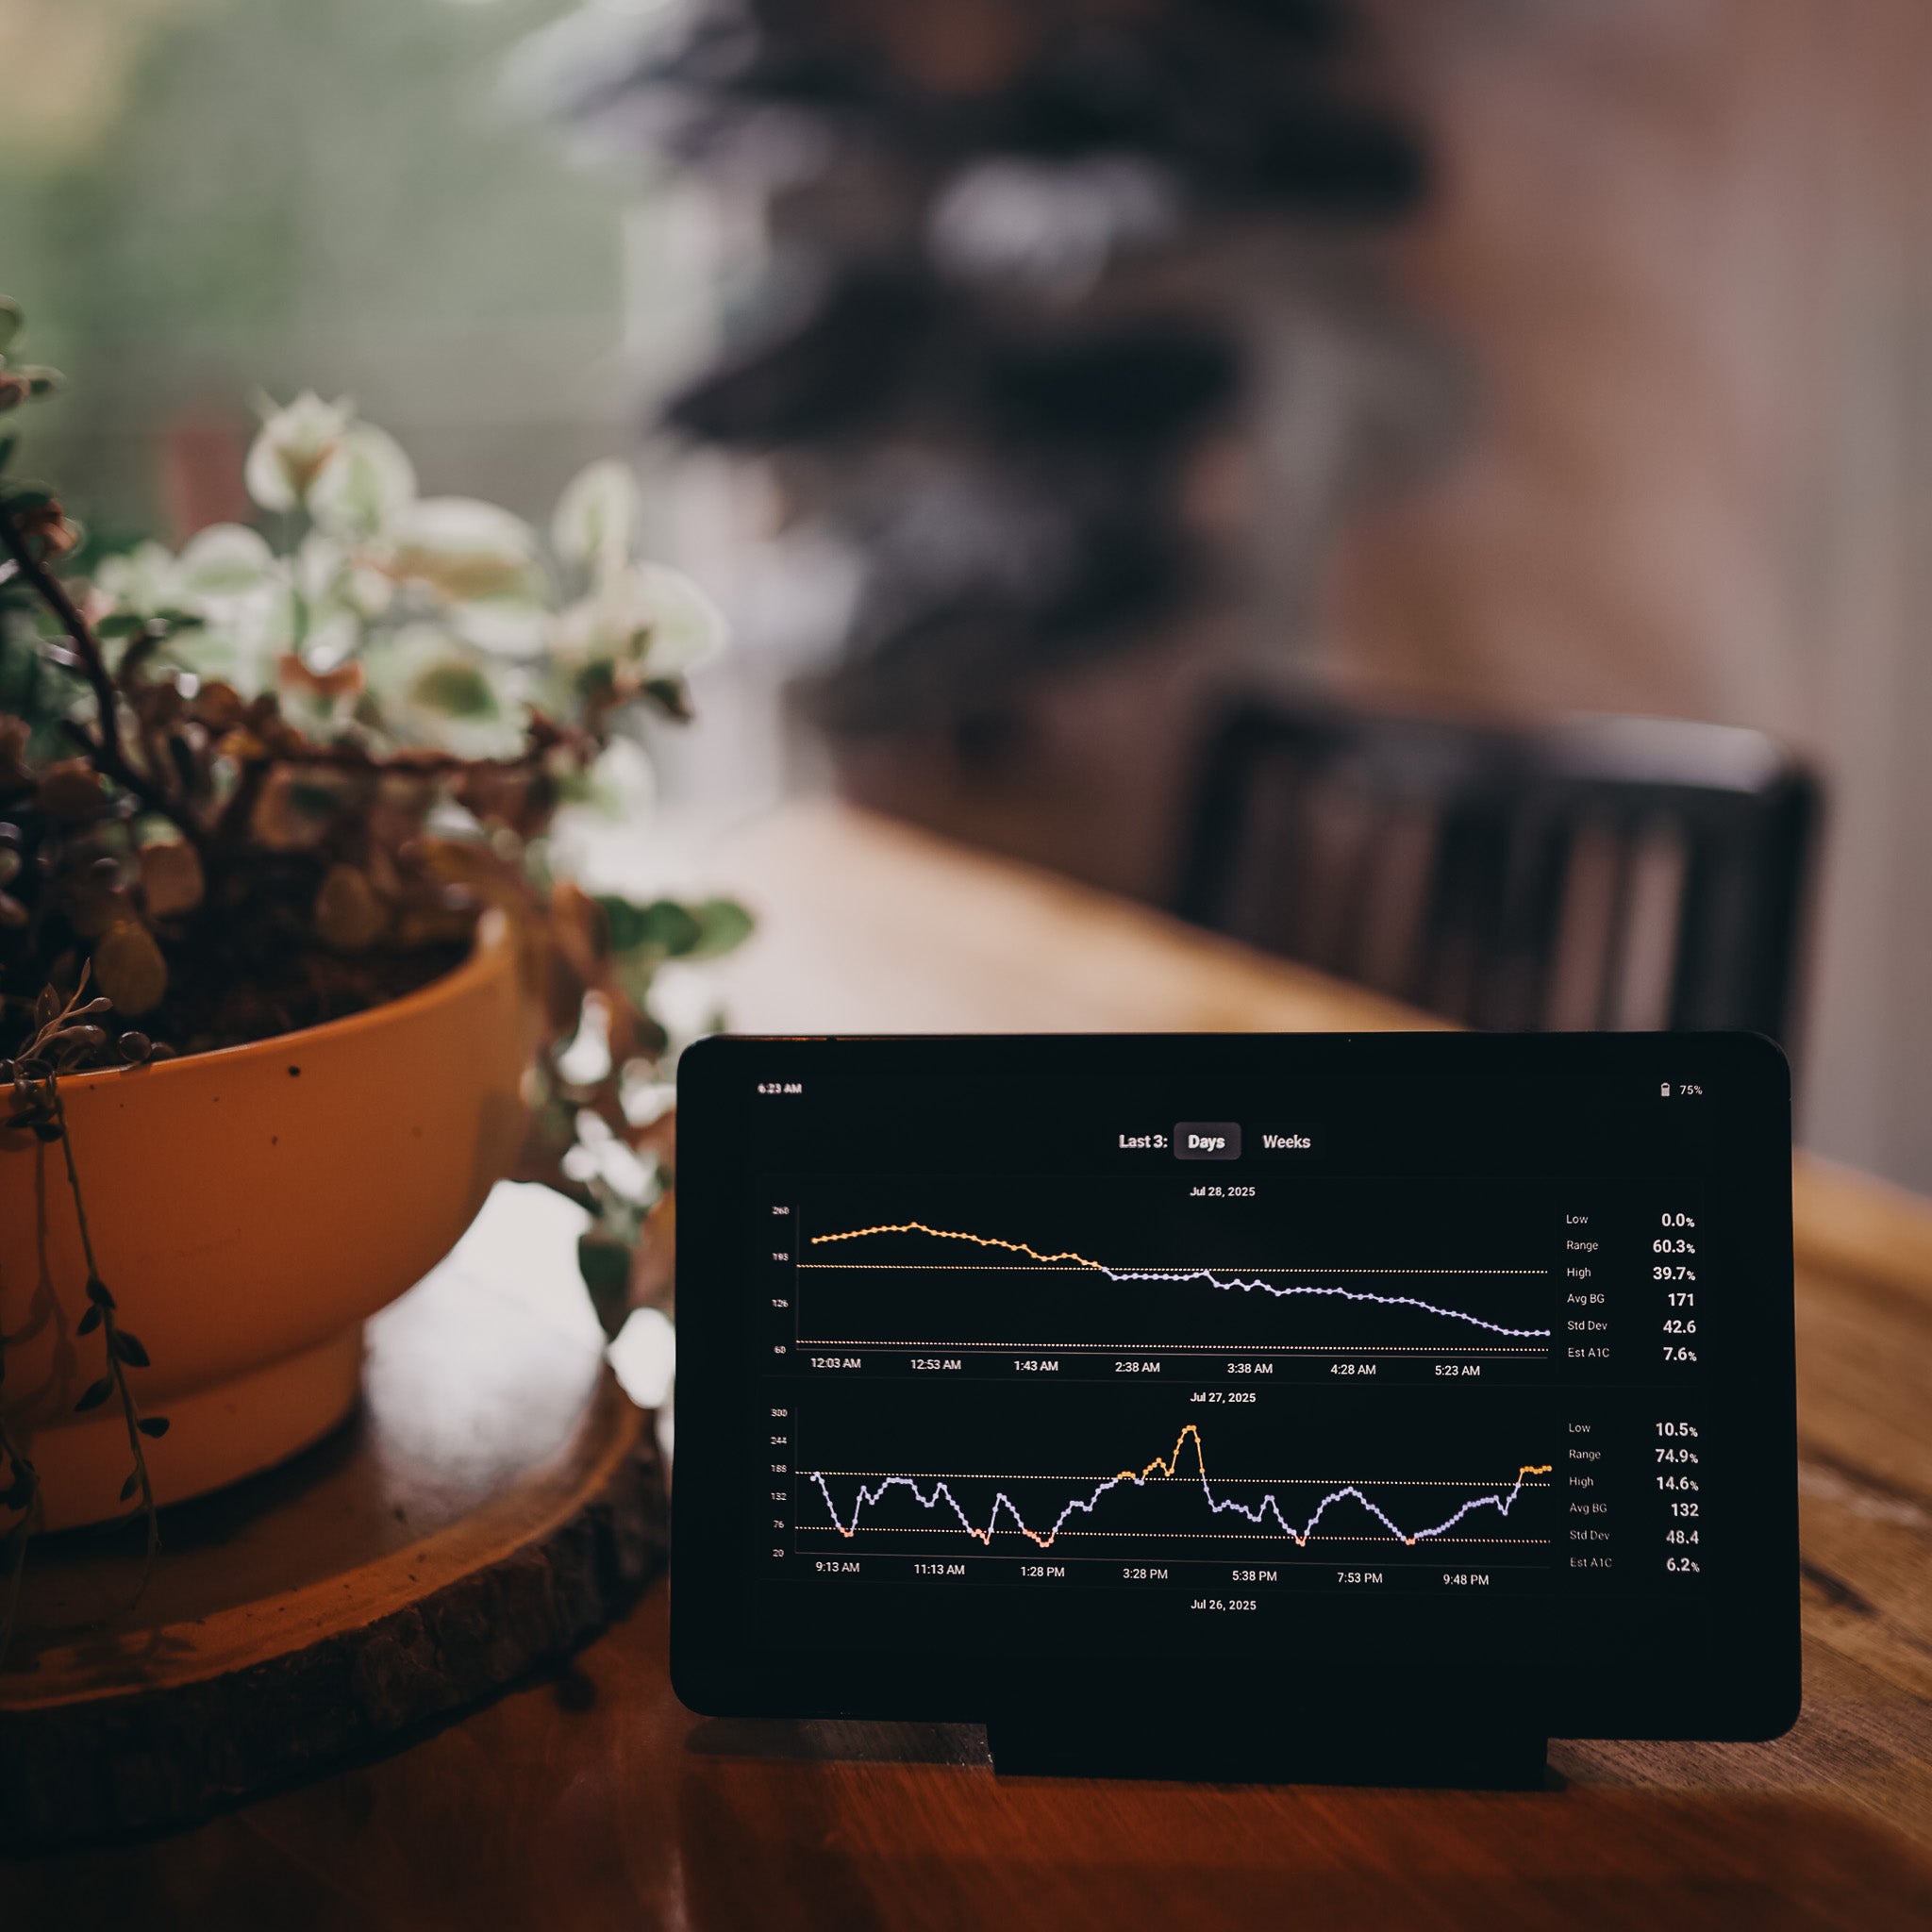
8. Last three days or weeks
Choose Days or Weeks under Last 3. The charts use available stored readings. You may not have a full history when first connecting, and gaps or missing backfill remain possible. Double-tap to return.
9. Light and dark mode
Use the dashboard mode button to switch between light and dark display styles.
10. Display brightness
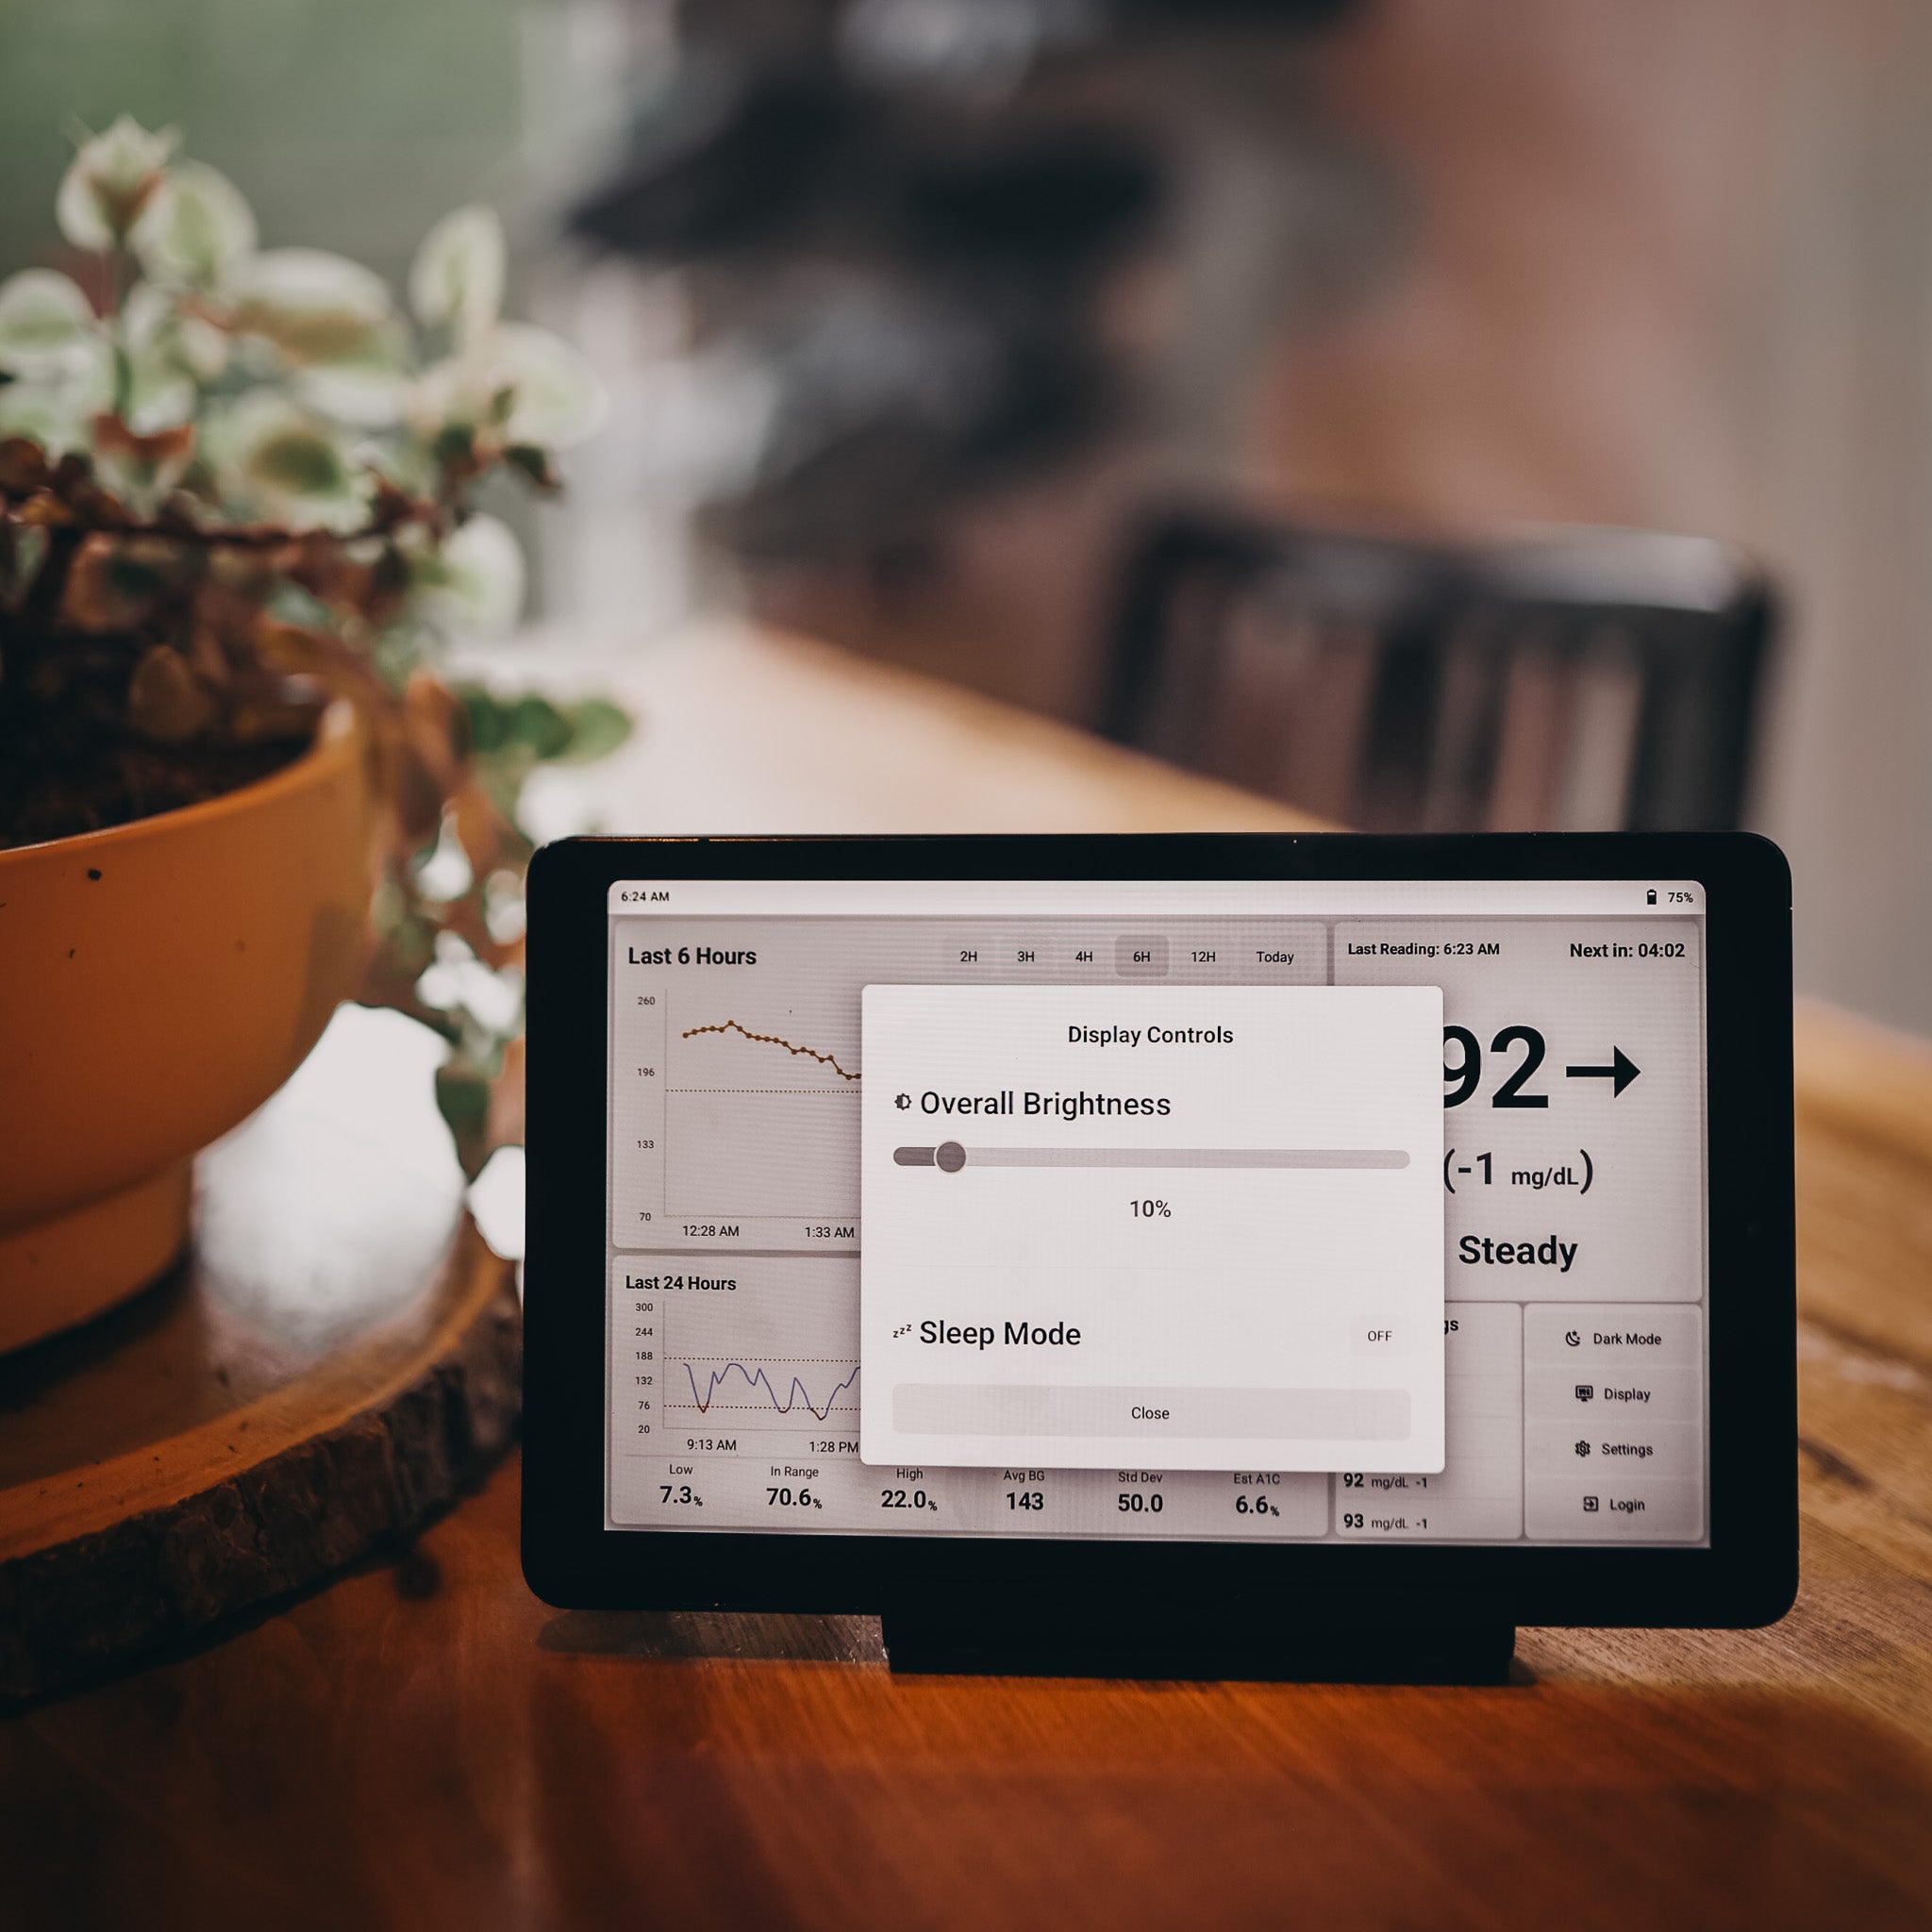
Use Brightness on the dashboard to open the brightness controls. Older screens may label this Display.
11. Sleep Mode
Brightness includes Sleep Mode for a dimmer display. The automatic schedule is in Settings → Sleep Mode.
12. Settings and accounts
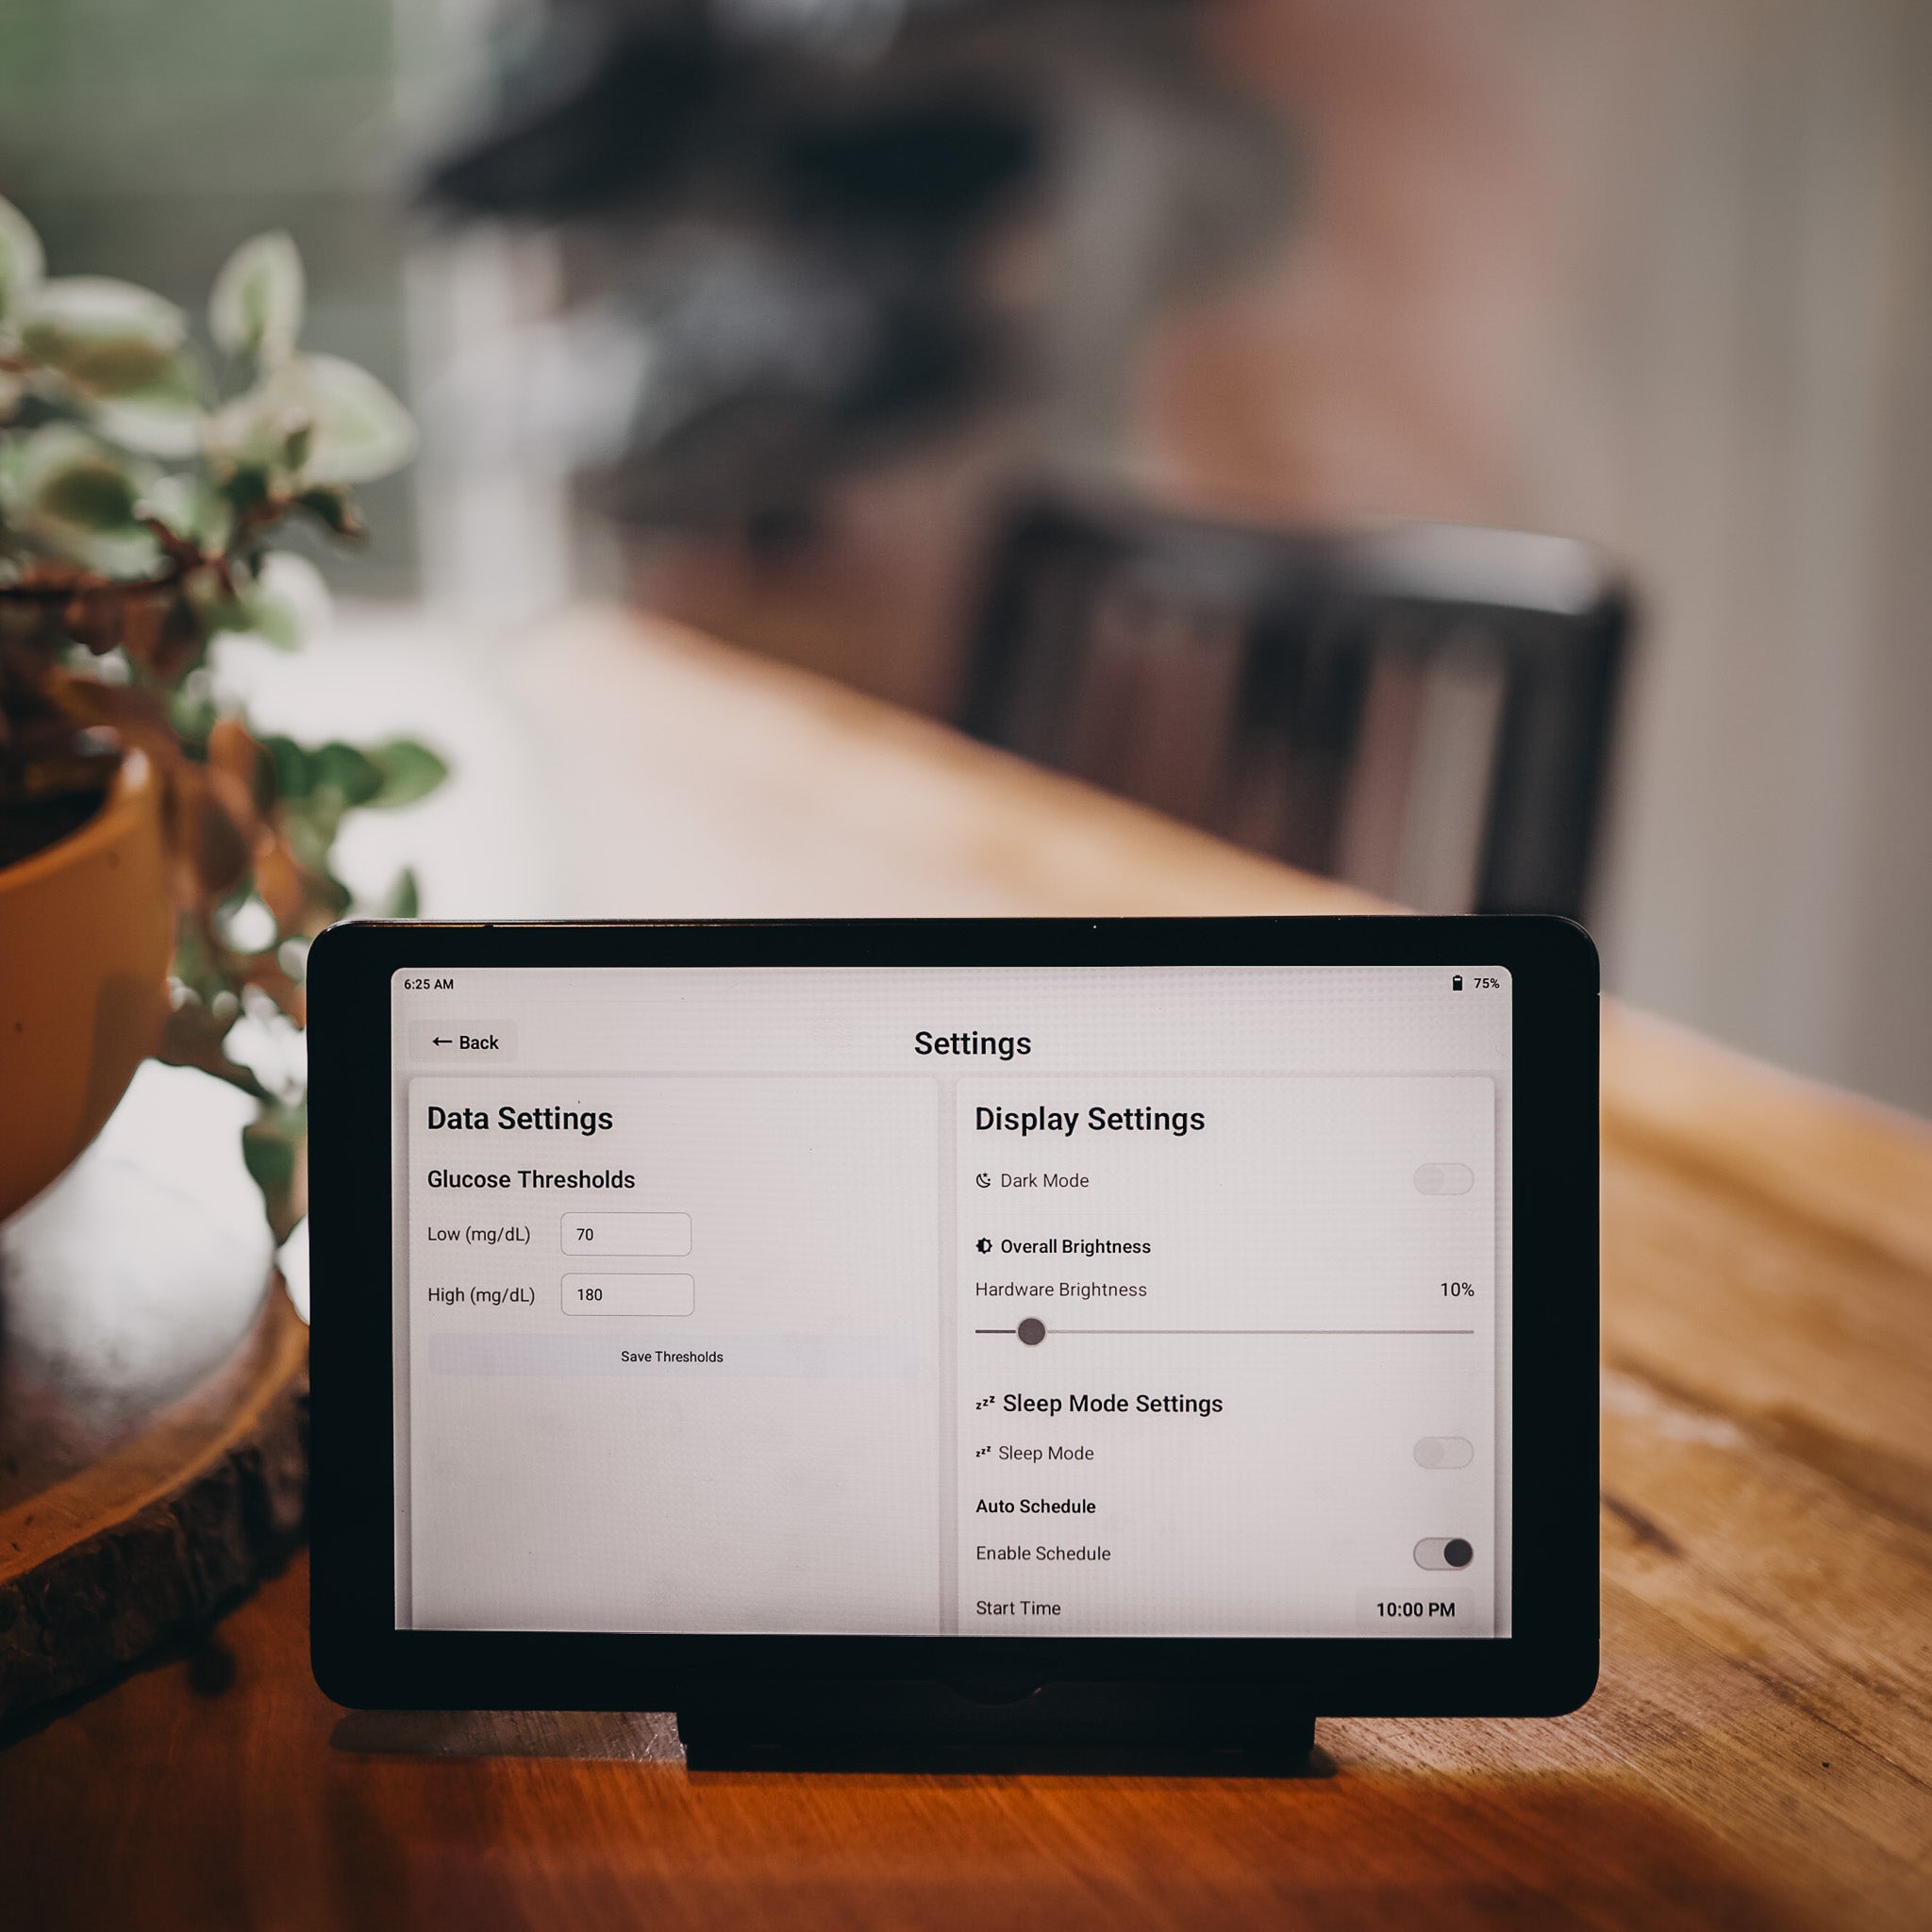
Settings includes display units, thresholds, alerts and day/night options. Use Login to change the active source account. The dashboard shows one active account at a time.
13. Thresholds and units
Display thresholds affect graph colors and displayed range statistics. Choose mg/dL or mmol/L under Settings → DATA → Display Units. Follow your care team’s guidance for your target range.
14. You’re ready
Thank you for supporting our small business. If something does not work as expected, start with troubleshooting or contact us. — The McLeod Family